 17
17peptides
spectra
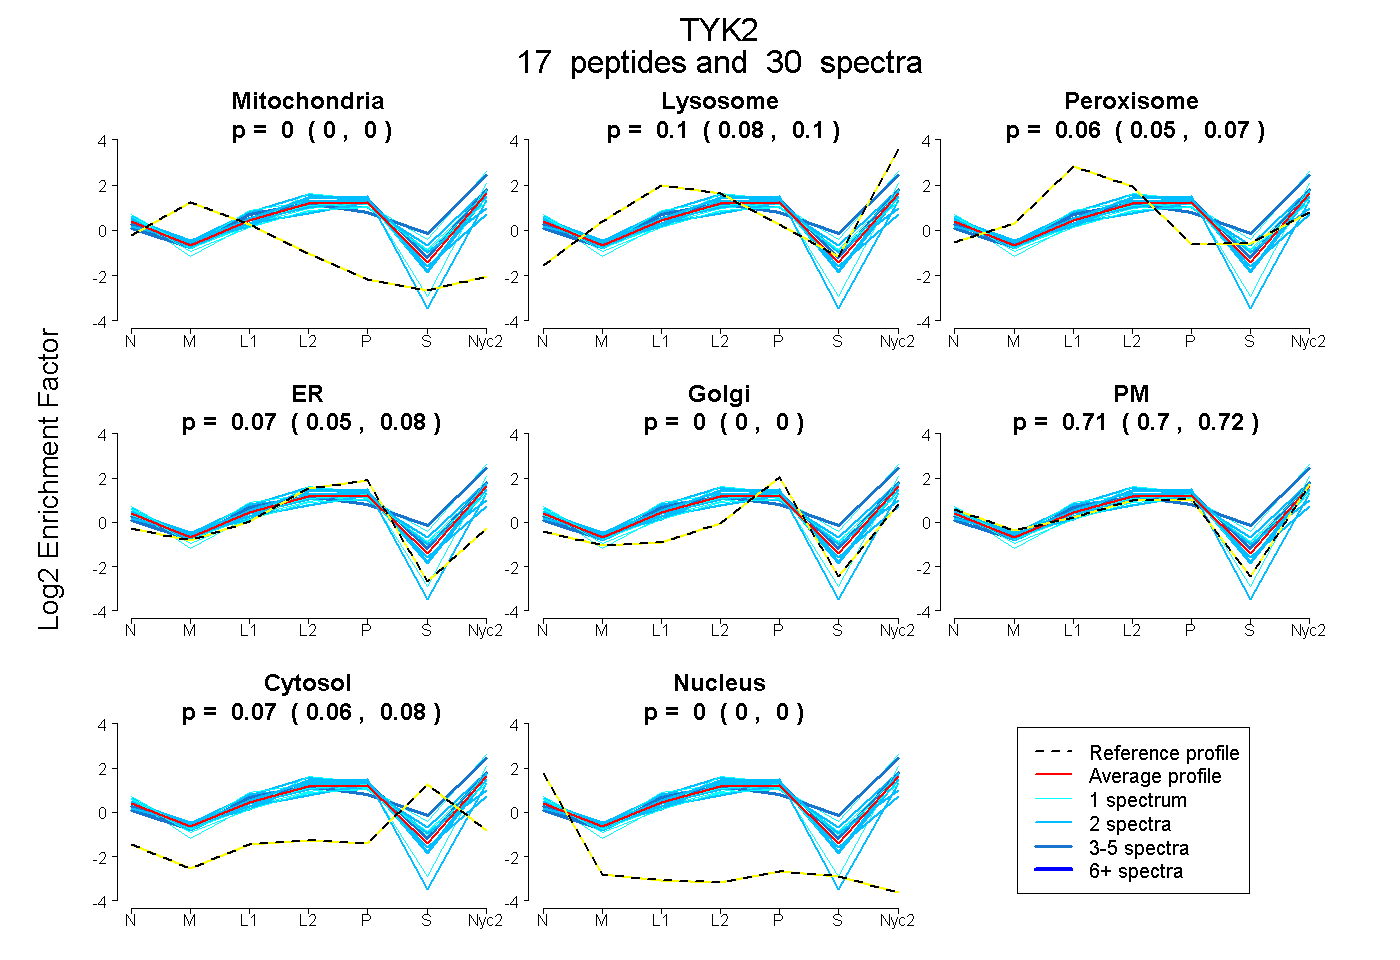
0.000 | 0.000
0.083 | 0.104
0.049 | 0.068
0.054 | 0.078
0.000 | 0.000
0.695 | 0.721
0.064 | 0.076
0.000 | 0.000
1peptide
spectrum
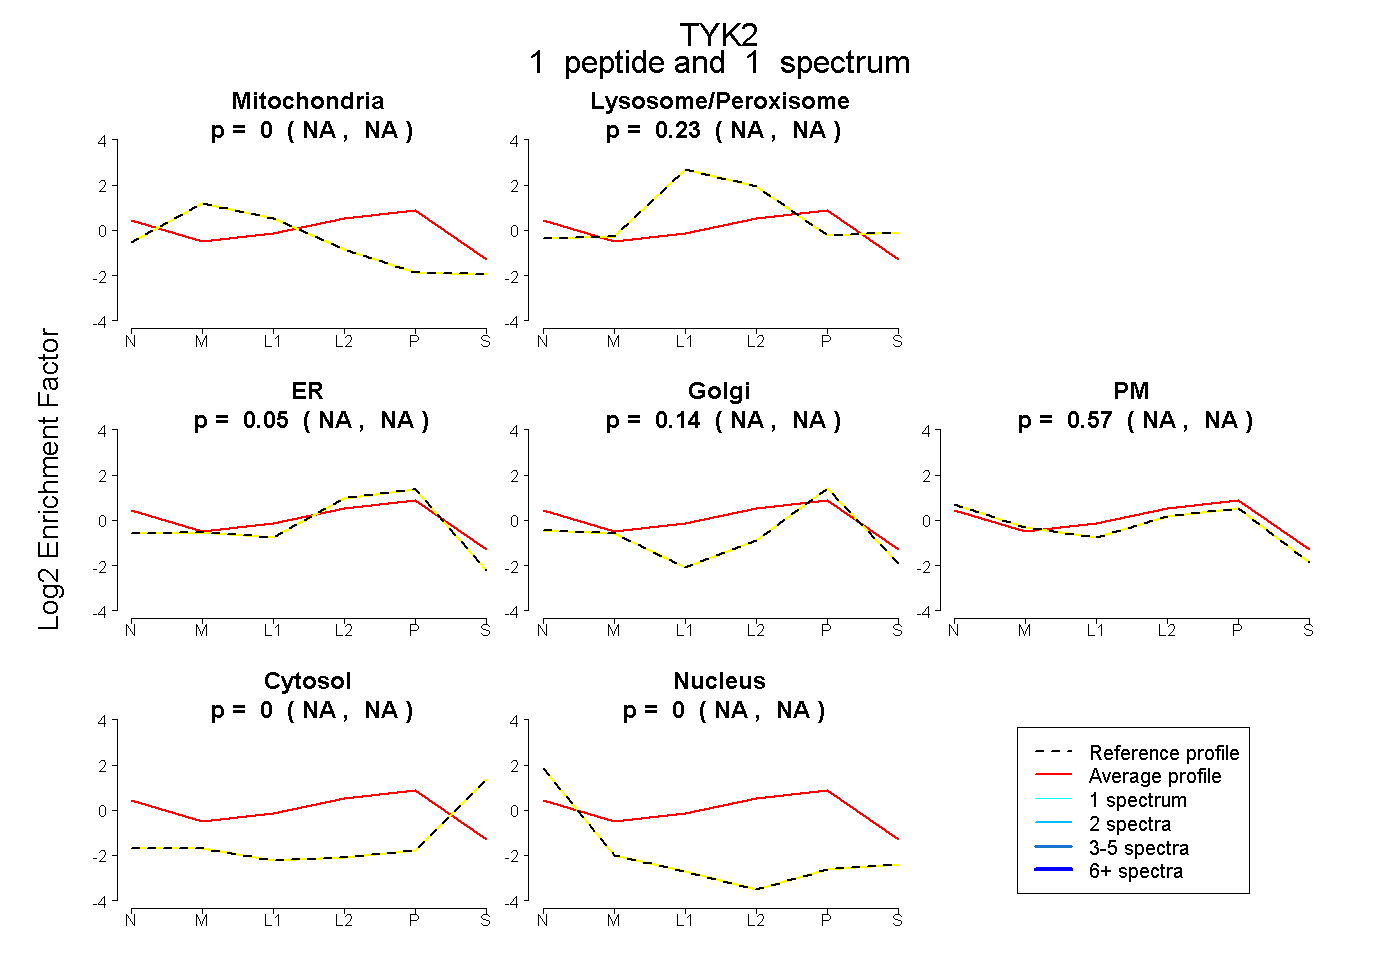
NA | NA
NA | NA
NA | NA
NA | NA
NA | NA
NA | NA
NA | NA
12peptides
spectra
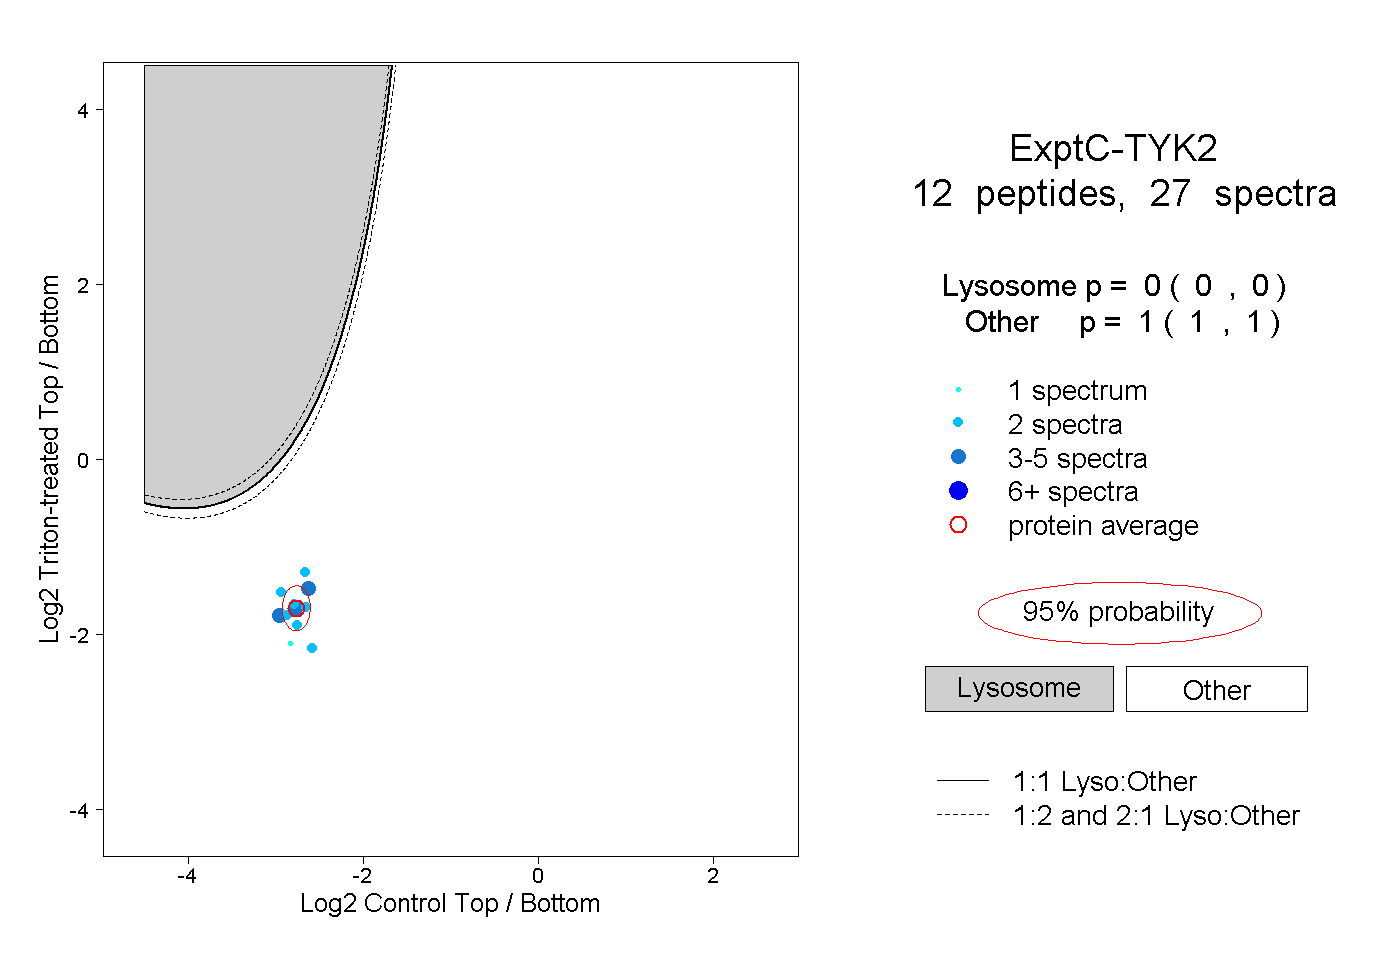
0.000 | 0.000
1.000 | 1.000
1peptide
spectra
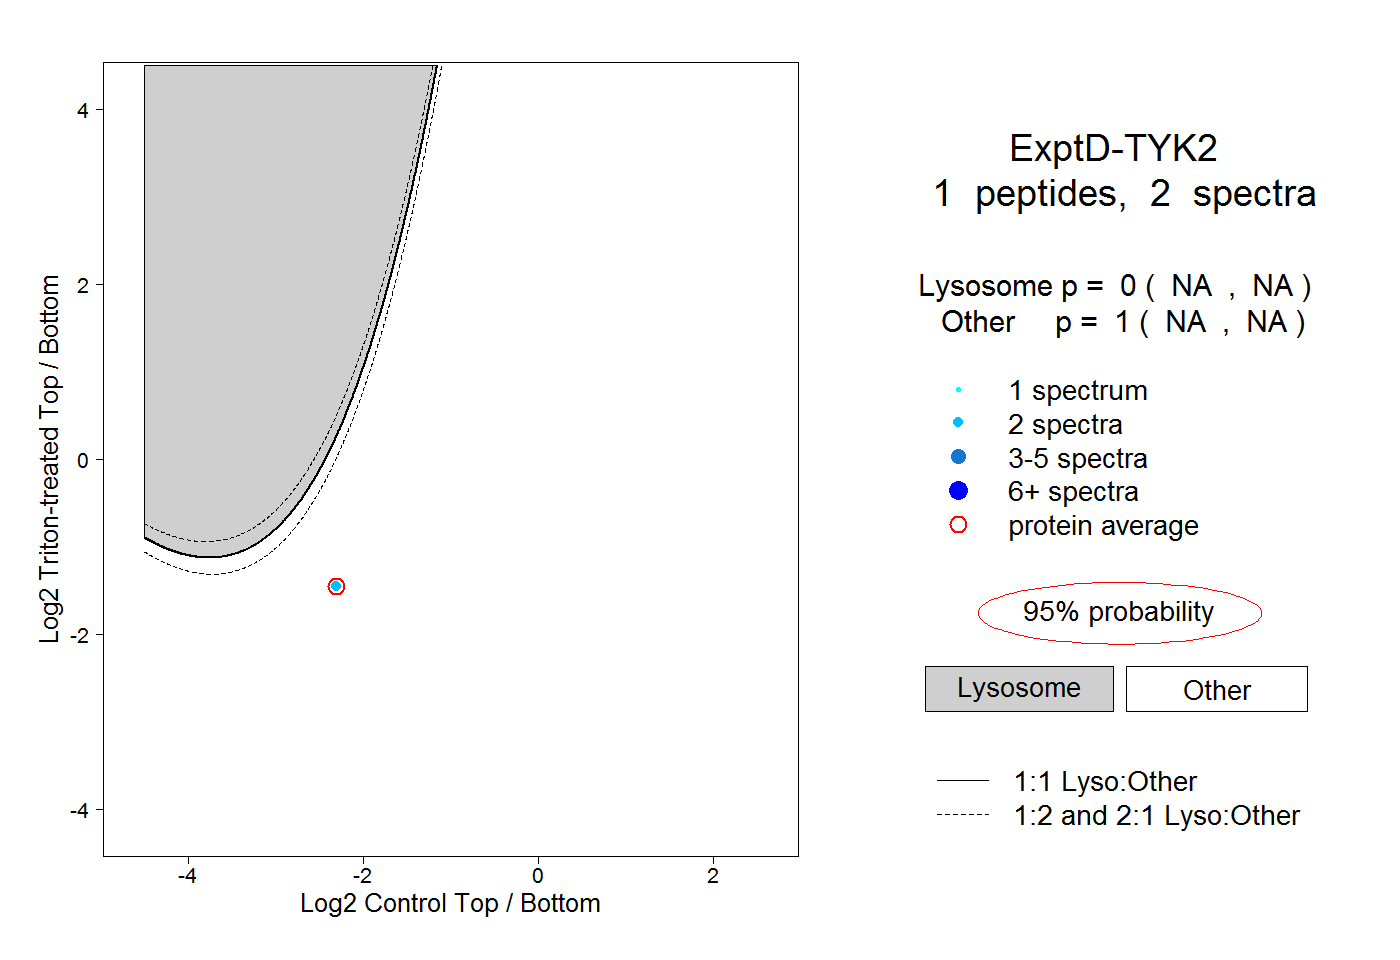
NA | NA
NA | NA