 5
5peptides
spectra
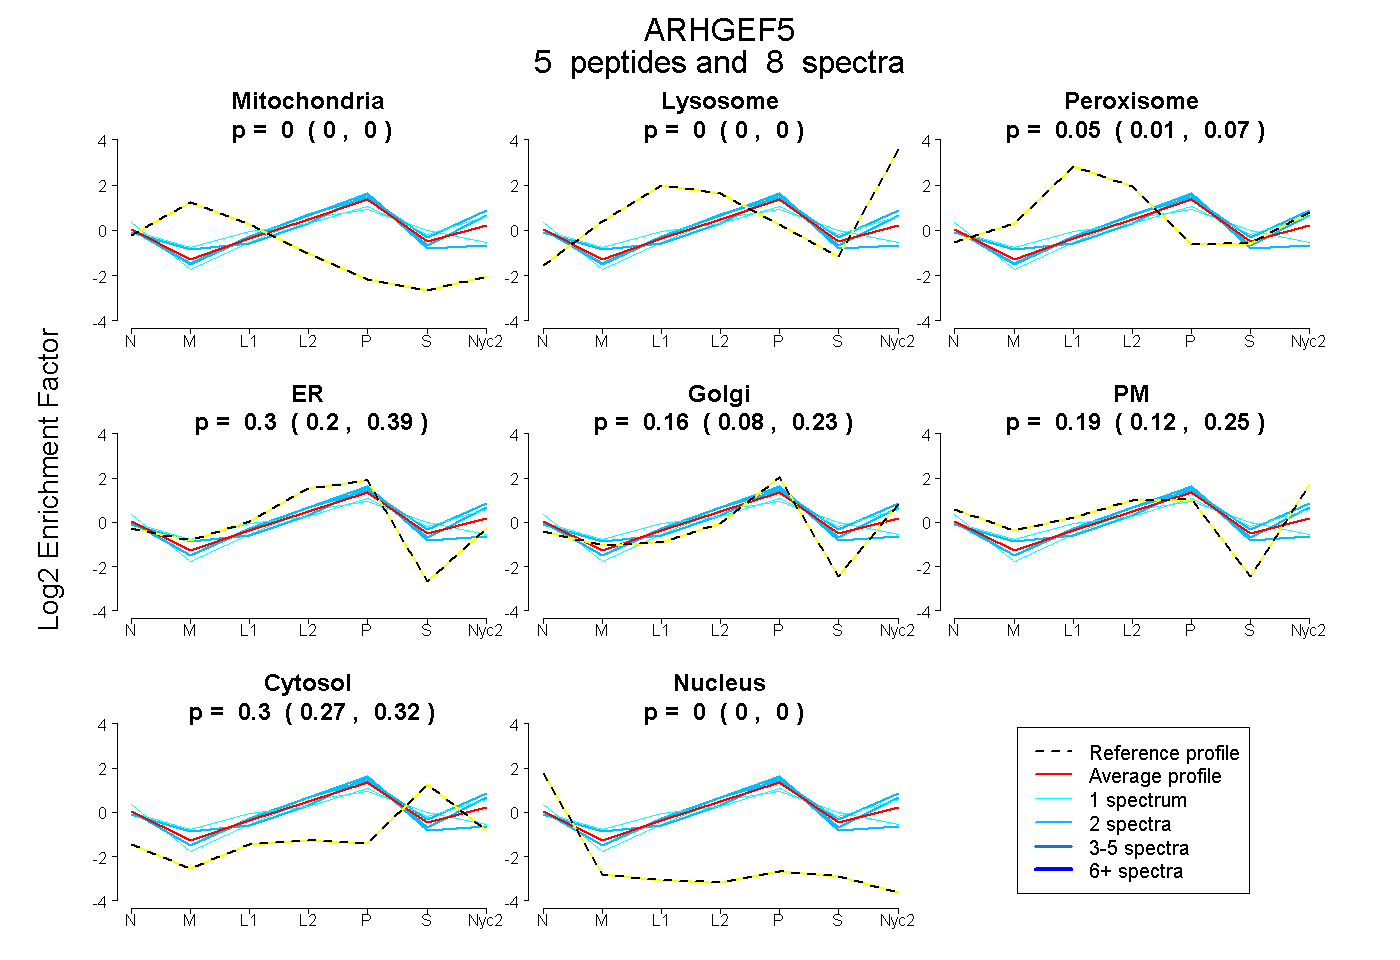
0.000 | 0.000
0.000 | 0.000
0.013 | 0.075
0.199 | 0.385
0.084 | 0.233
0.120 | 0.249
0.268 | 0.319
0.000 | 0.000
| Plot | Mito | Lyso | Perox | ER | Golgi | PM | Cytosol | Nucleus | |||||
| Expt A |
5 peptides |
8 spectra |
|
0.000 0.000 | 0.000 |
0.000 0.000 | 0.000 |
0.046 0.013 | 0.075 |
0.299 0.199 | 0.385 |
0.164 0.084 | 0.233 |
0.194 0.120 | 0.249 |
0.297 0.268 | 0.319 |
0.000 0.000 | 0.000 |
| 1 spectrum, SGELTALEFSVSPGLK | 0.000 | 0.000 | 0.226 | 0.000 | 0.340 | 0.181 | 0.254 | 0.000 | ||
| 1 spectrum, ENDELALEK | 0.000 | 0.000 | 0.000 | 0.468 | 0.000 | 0.088 | 0.443 | 0.000 | ||
| 2 spectra, SFLILPFQR | 0.000 | 0.051 | 0.000 | 0.262 | 0.211 | 0.237 | 0.239 | 0.000 | ||
| 2 spectra, LHGAHK | 0.000 | 0.000 | 0.000 | 0.558 | 0.152 | 0.000 | 0.291 | 0.000 | ||
| 2 spectra, IFPLISQSR | 0.000 | 0.077 | 0.000 | 0.171 | 0.165 | 0.303 | 0.284 | 0.000 |
| Plot | Lyso | Other | |||||||||||
| Expt C |
2 peptides |
2 spectra |
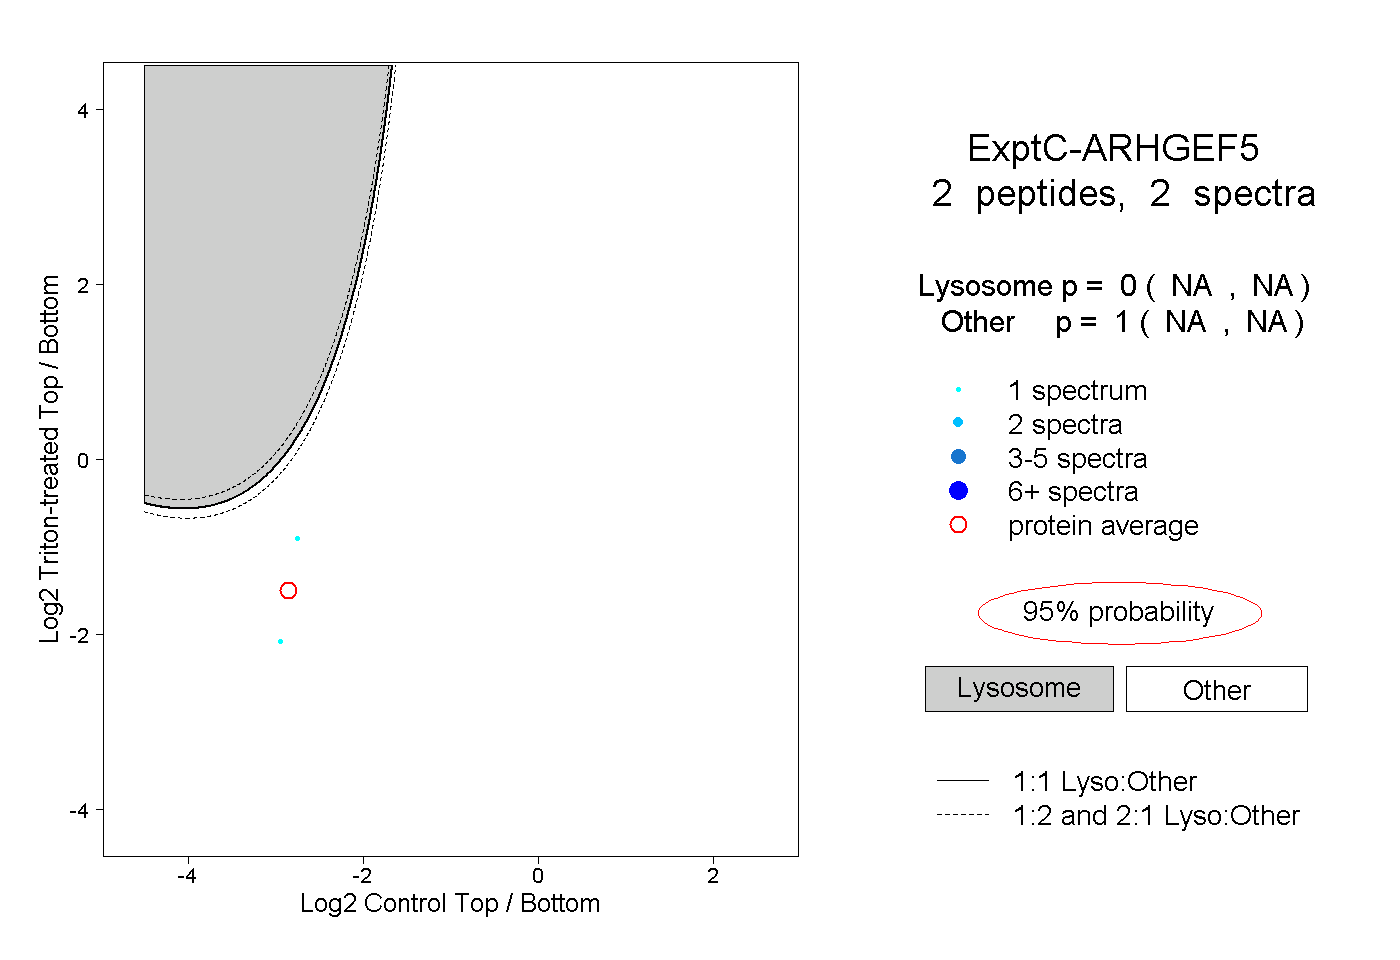 |
0.000 NA | NA |
1.000 NA | NA |