4
4peptides
spectra
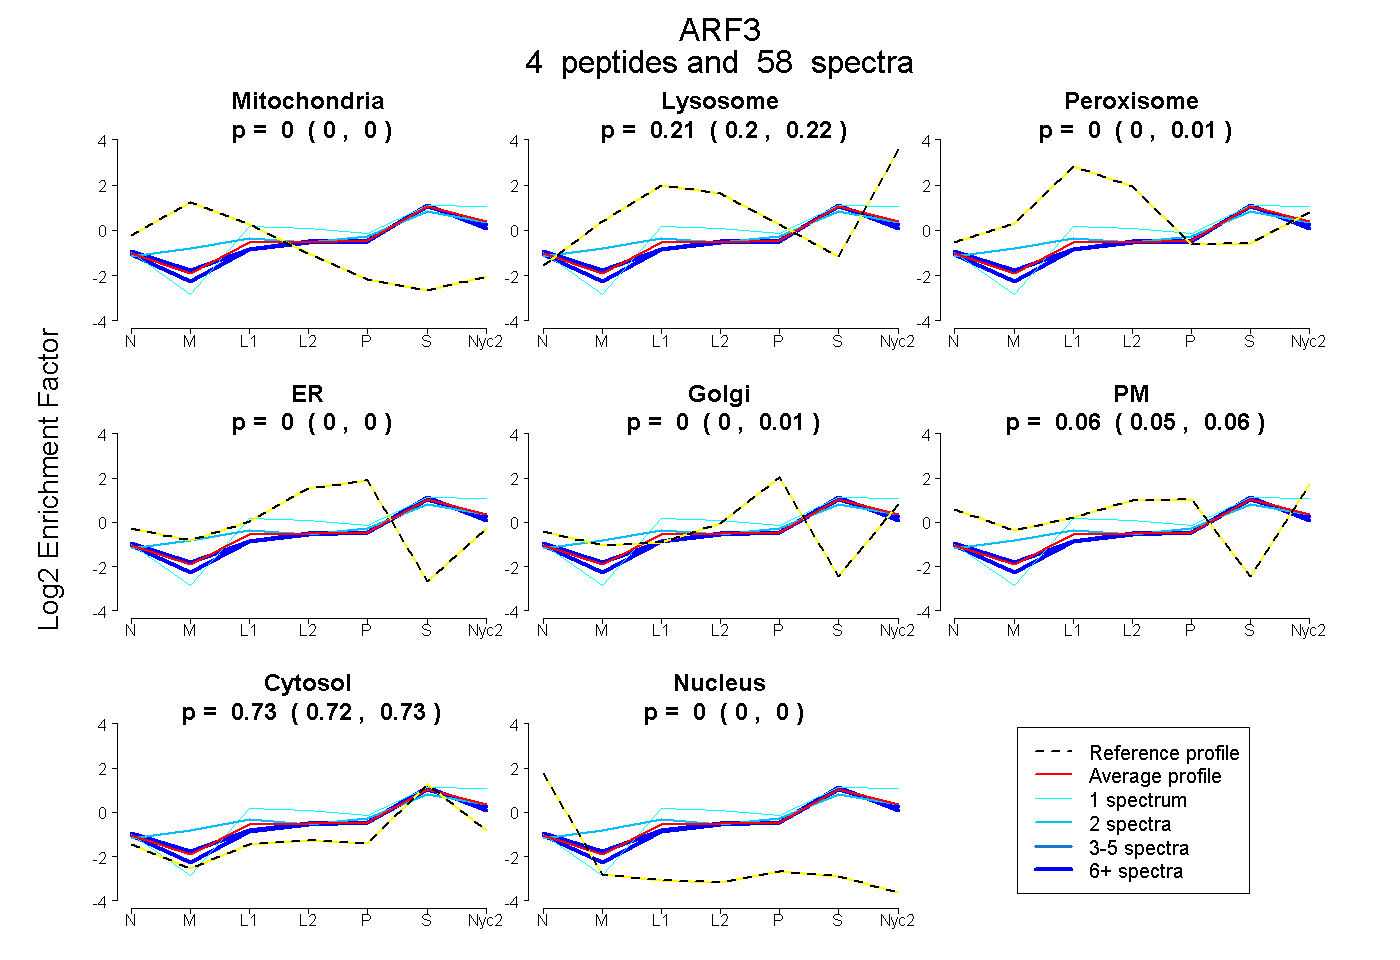
0.000 | 0.000
0.199 | 0.219
0.000 | 0.010
0.000 | 0.000
0.000 | 0.007
0.051 | 0.065
0.722 | 0.732
0.000 | 0.000
4peptides
spectra
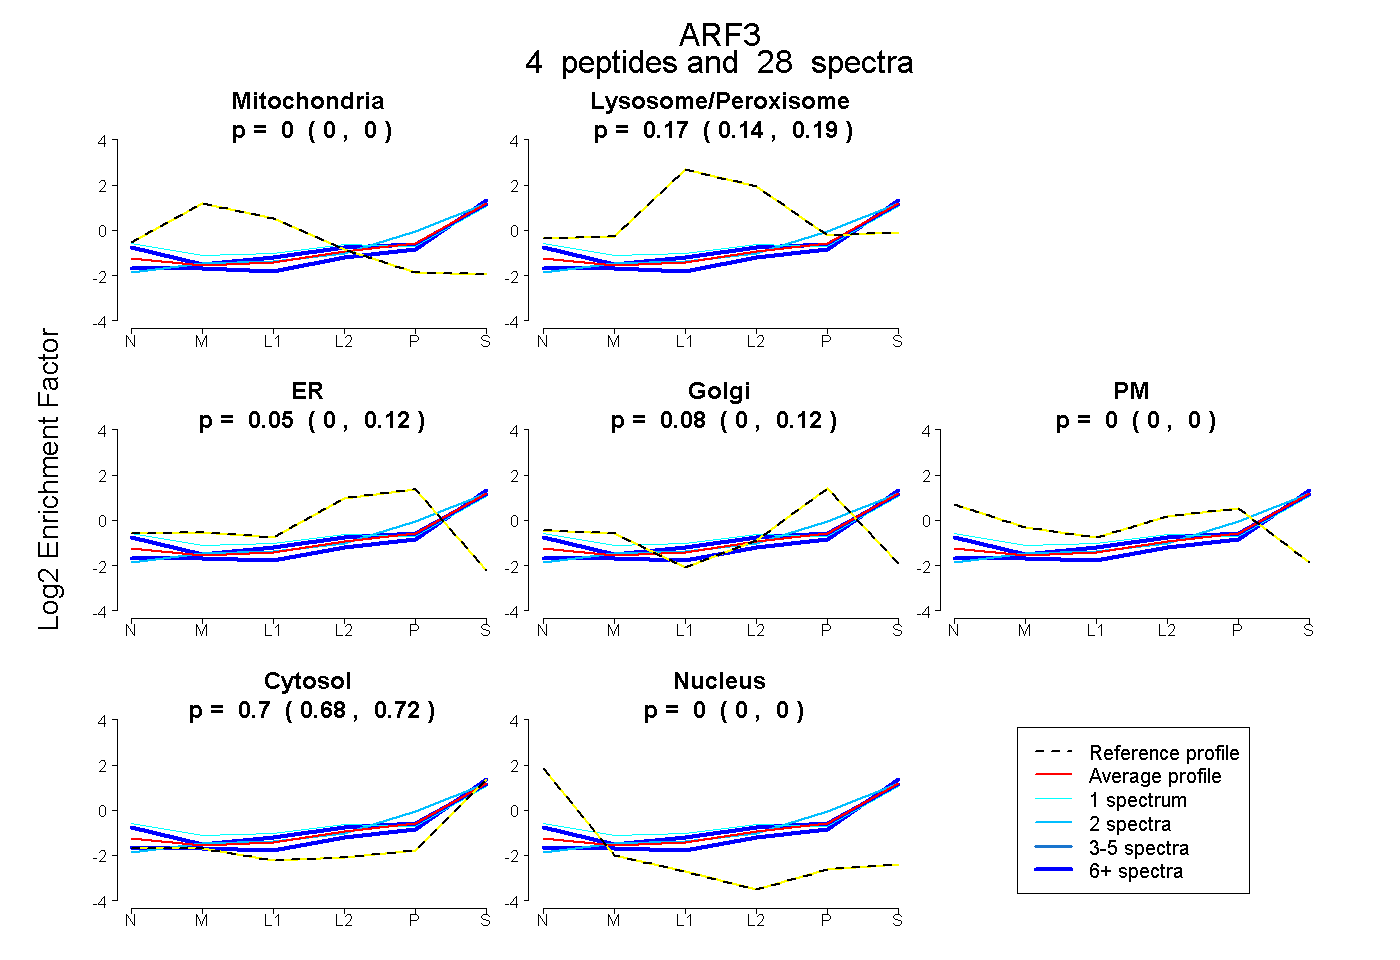
0.000 | 0.000
0.141 | 0.193
0.000 | 0.121
0.000 | 0.124
0.000 | 0.000
0.679 | 0.721
0.000 | 0.000
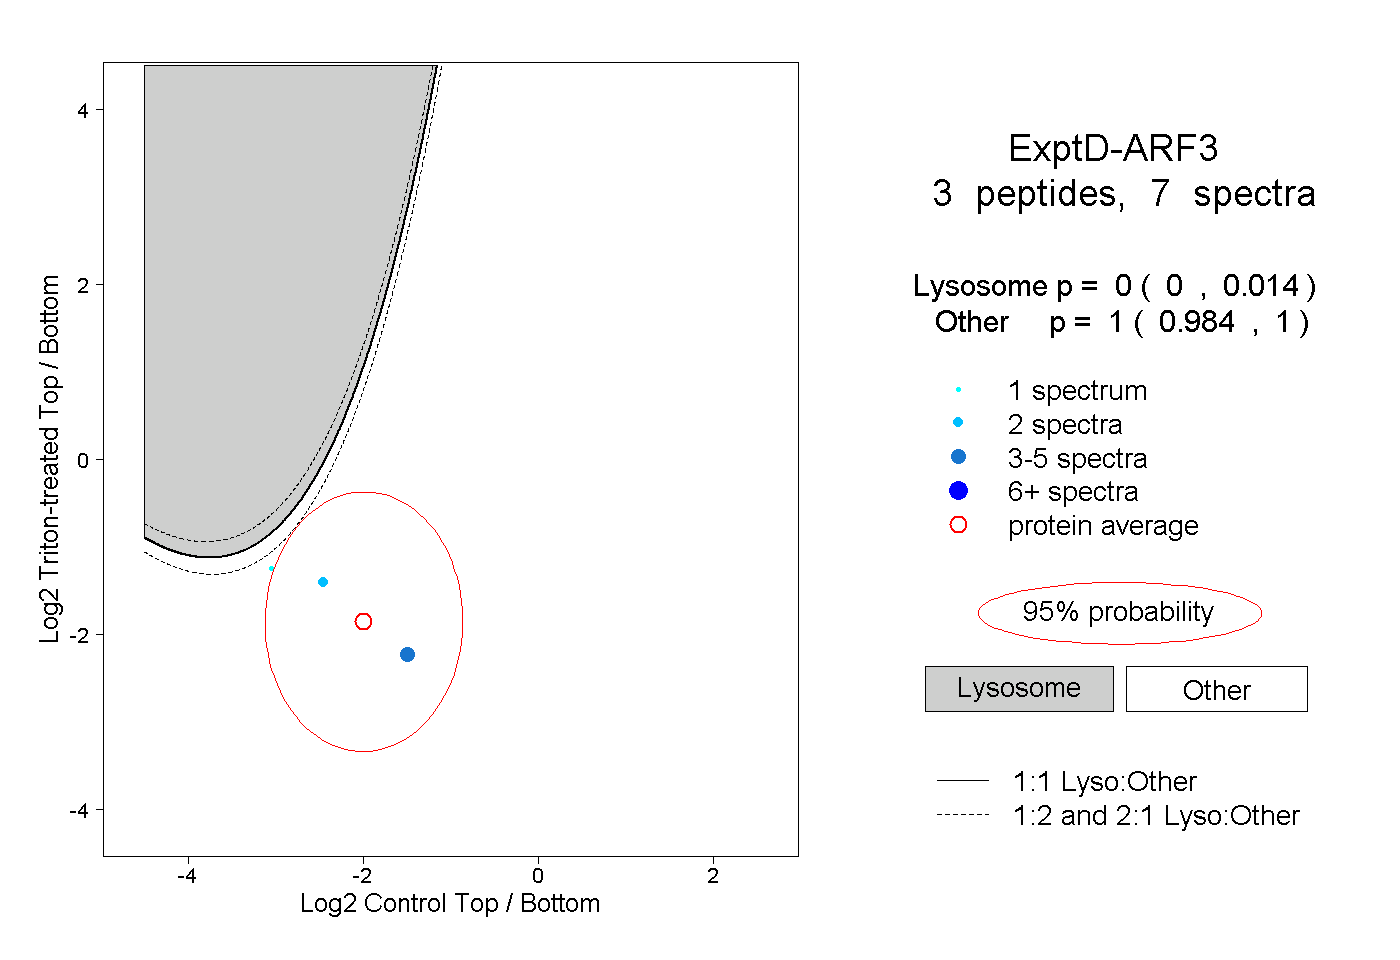
10peptides
spectra
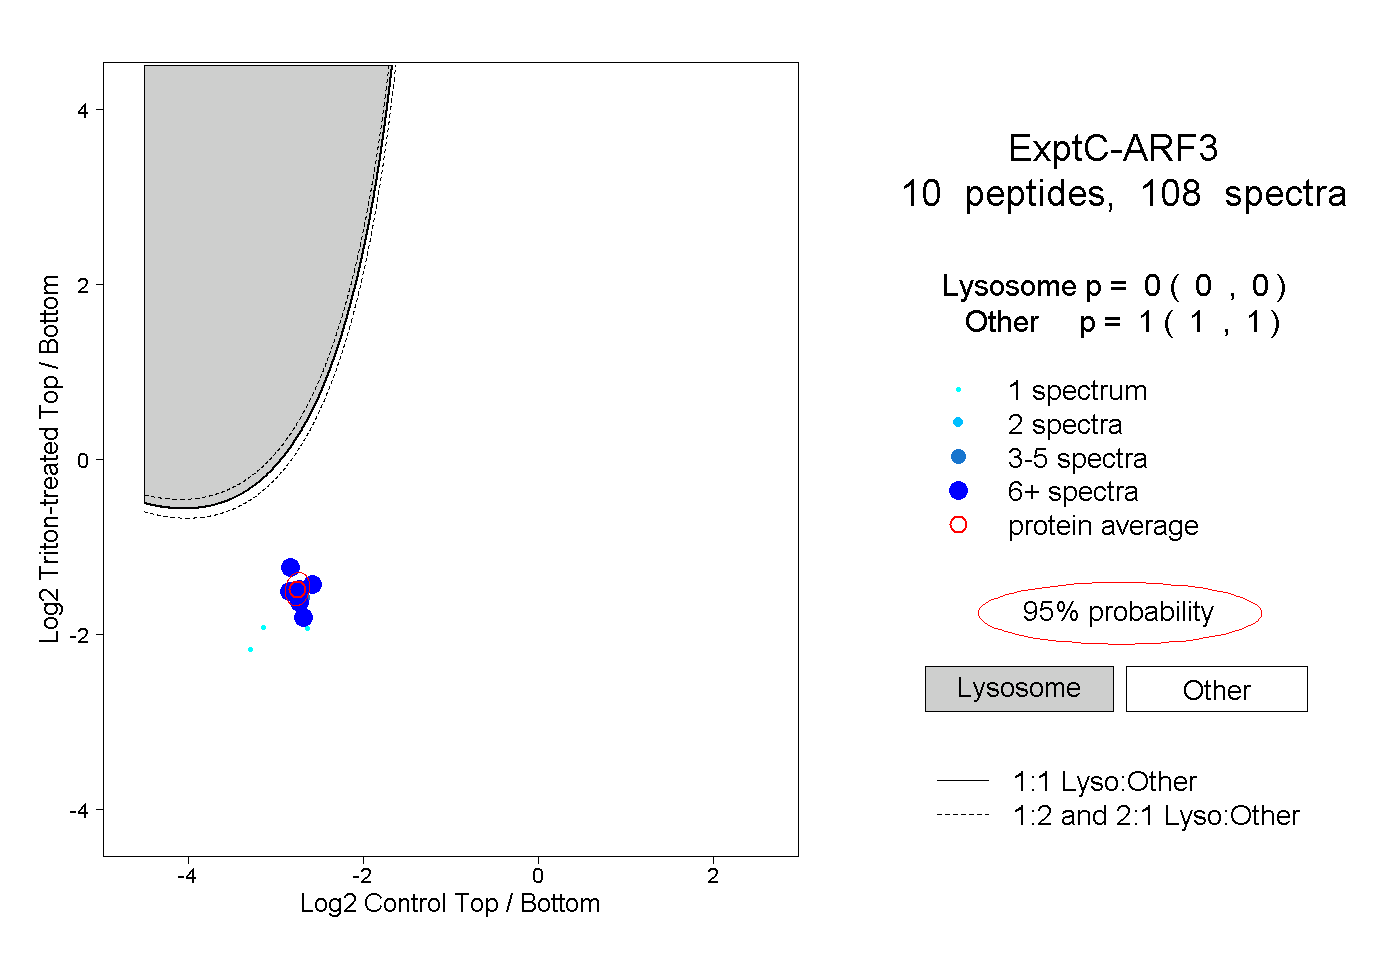
0.000 | 0.000
1.000 | 1.000