 4
4peptides
spectra
0.000 | 0.000
0.199 | 0.219
0.000 | 0.010
0.000 | 0.000
0.000 | 0.007
0.051 | 0.065
0.722 | 0.732
0.000 | 0.000
| Plot | Mito | Lyso | Perox | ER | Golgi | PM | Cytosol | Nucleus | |||||
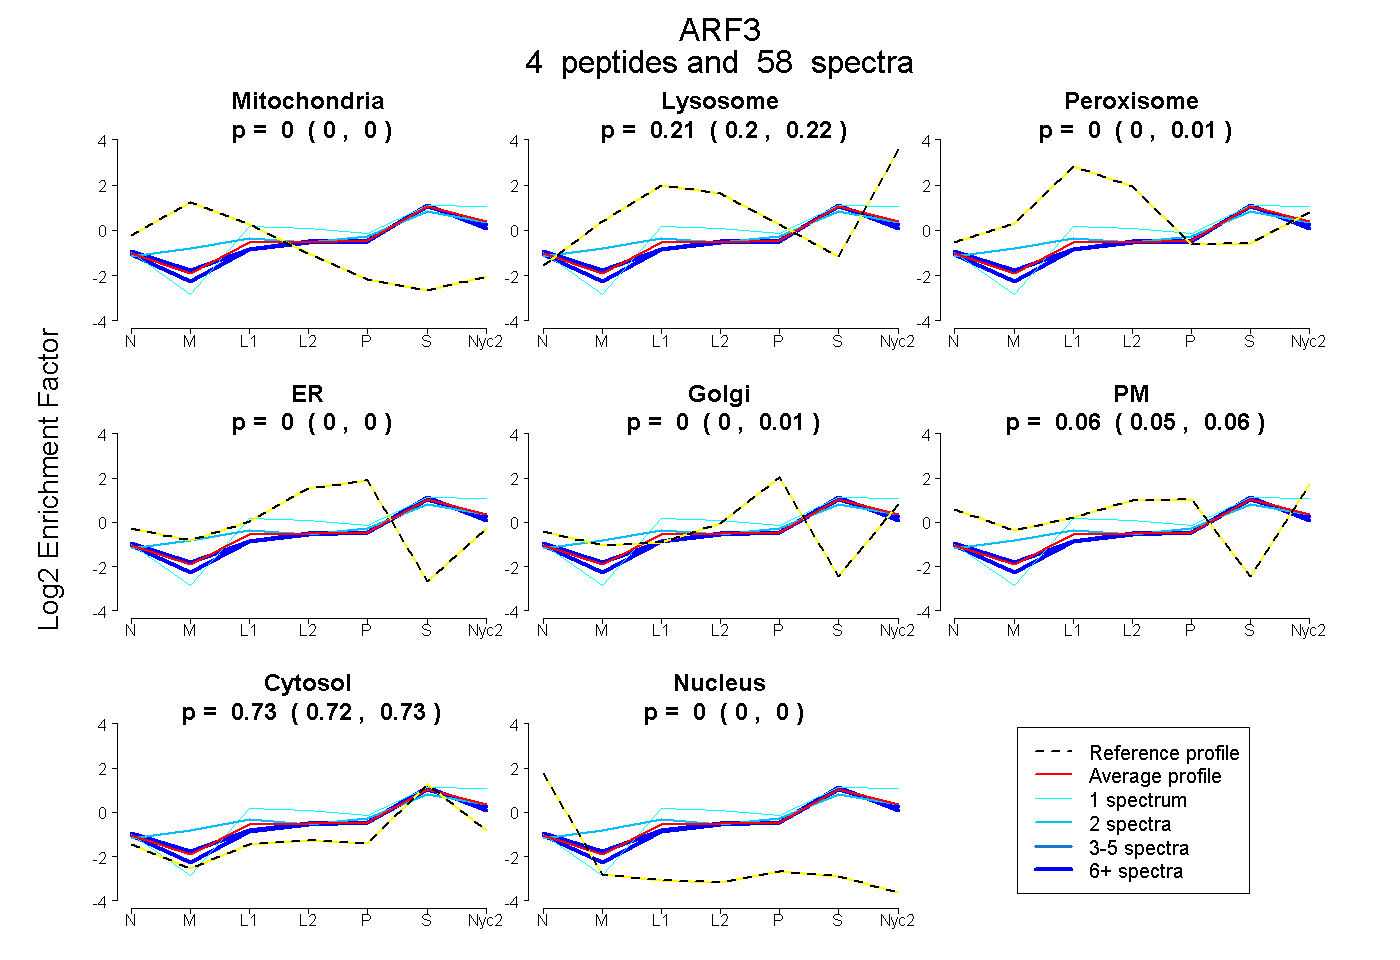
| Expt A |
4 peptides |
58 spectra |
|
0.000 0.000 | 0.000 |
0.211 0.199 | 0.219 |
0.000 0.000 | 0.010 |
0.000 0.000 | 0.000 |
0.000 0.000 | 0.007 |
0.061 0.051 | 0.065 |
0.728 0.722 | 0.732 |
0.000 0.000 | 0.000 |
| 15 spectra, MLAEDELR | 0.000 | 0.154 | 0.000 | 0.000 | 0.000 | 0.107 | 0.739 | 0.000 | ||
| 1 spectrum, NISFTVWDVGGQDK | 0.000 | 0.341 | 0.000 | 0.000 | 0.000 | 0.000 | 0.659 | 0.000 | ||
| 40 spectra, LGLHSLR | 0.000 | 0.136 | 0.000 | 0.000 | 0.043 | 0.042 | 0.779 | 0.000 | ||
| 2 spectra, QDLPNAMNAAEITDK | 0.016 | 0.233 | 0.073 | 0.000 | 0.073 | 0.000 | 0.606 | 0.000 |
| Plot | Mito | Lyso or Perox | ER | Golgi | PM | Cytosol | Nucleus | ||||||
| Expt B |
4 peptides |
28 spectra |
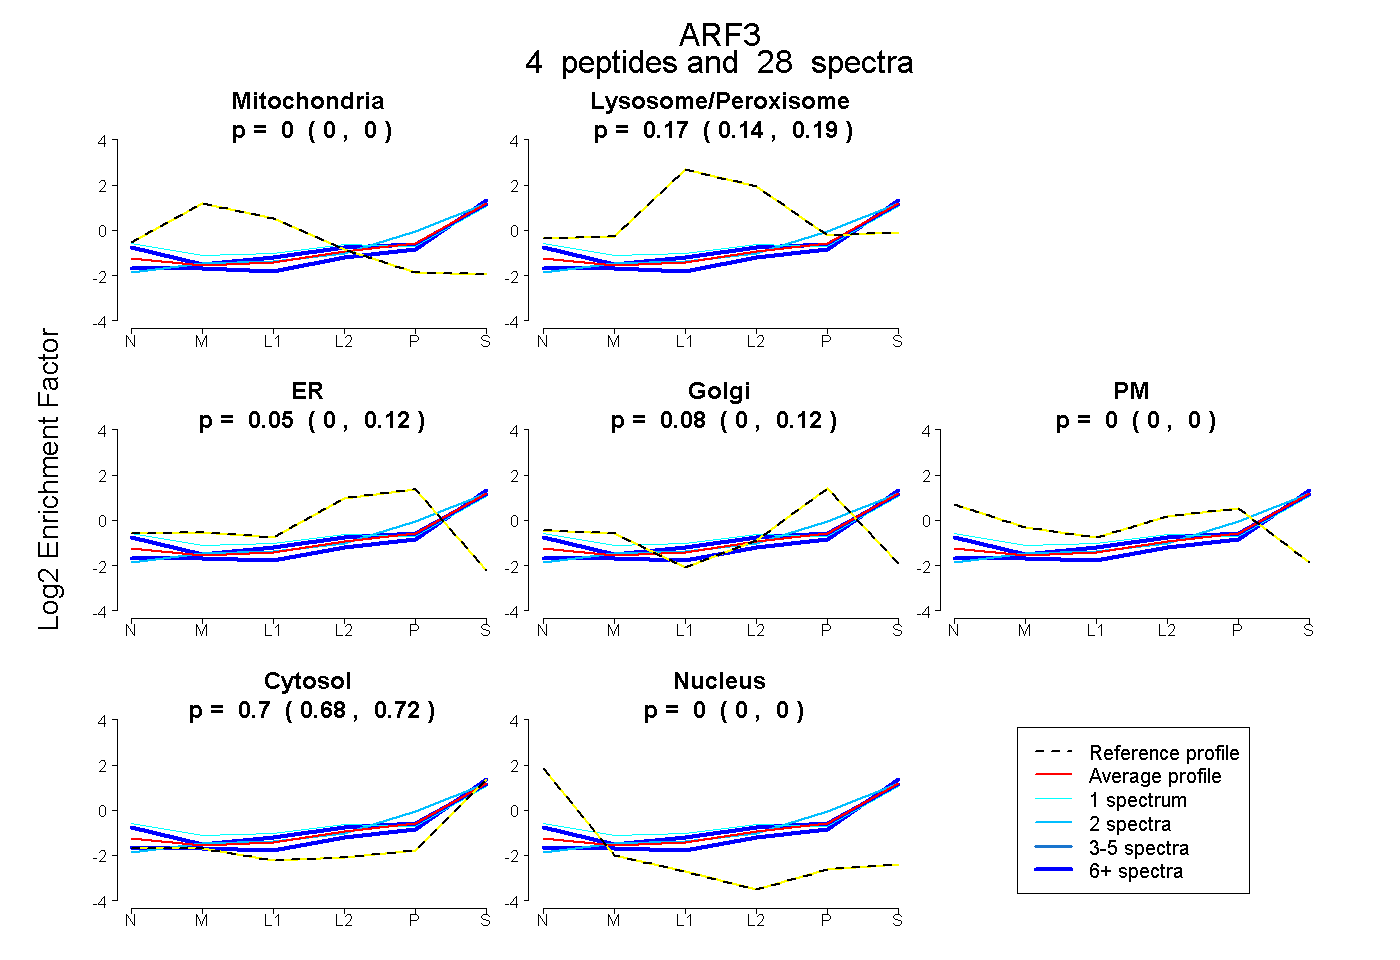 |
0.000 0.000 | 0.000 |
0.171 0.141 | 0.193 |
0.054 0.000 | 0.121 |
0.075 0.000 | 0.124 |
0.000 0.000 | 0.000 |
0.700 0.679 | 0.721 |
0.000 0.000 | 0.000 |
|||
| Plot | Lyso | Other | |||||||||||
| Expt C |
10 peptides |
108 spectra |
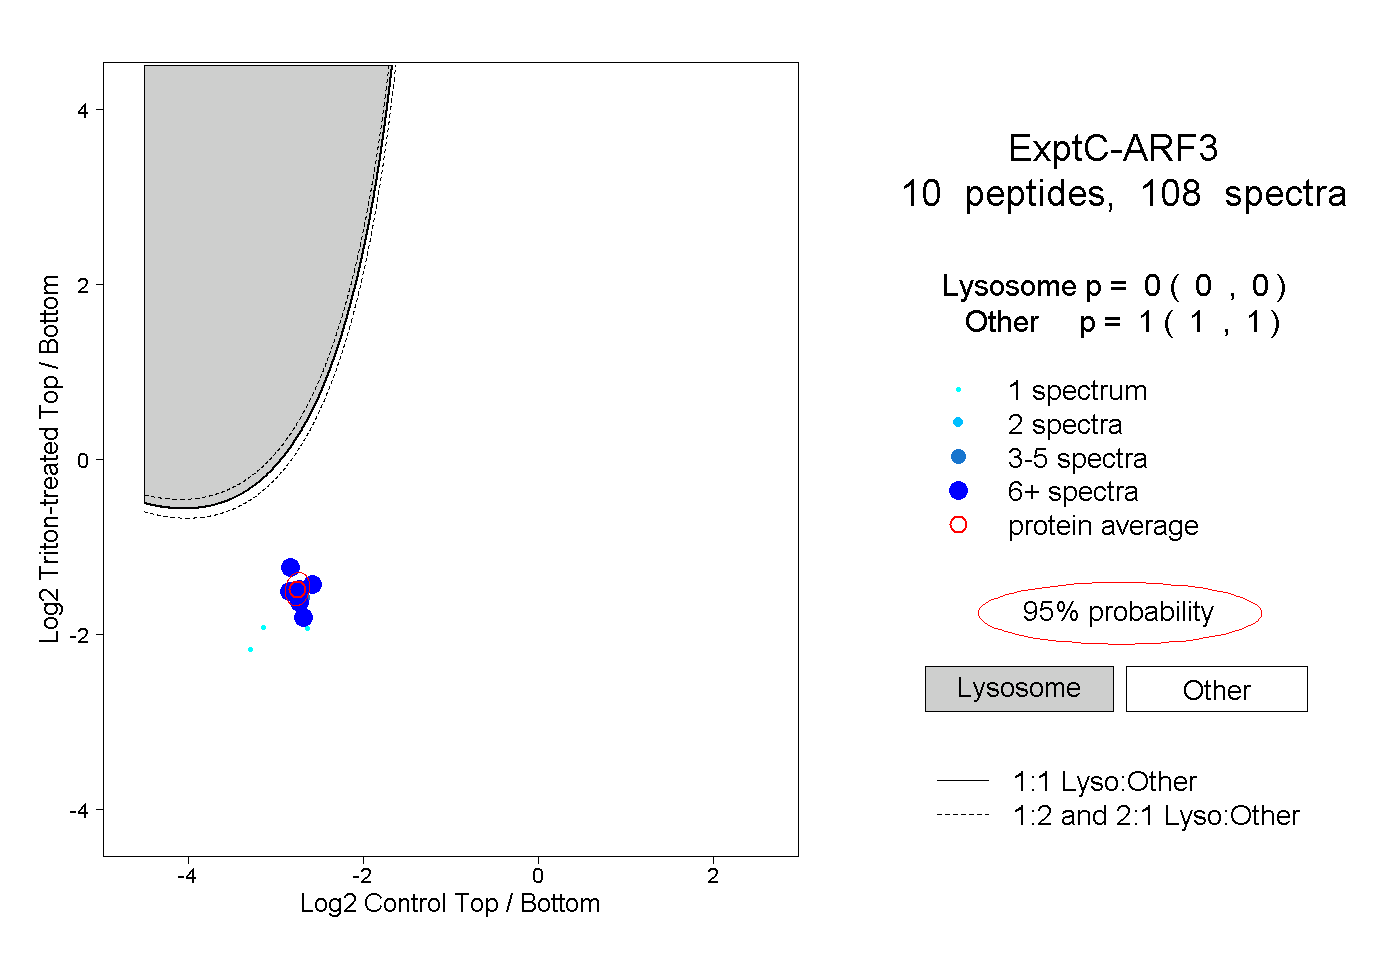 |
0.000 0.000 | 0.000 |
1.000 1.000 | 1.000 |
||||||||
| Plot | Lyso | Other | |||||||||||
| Expt D |
3 peptides |
7 spectra |
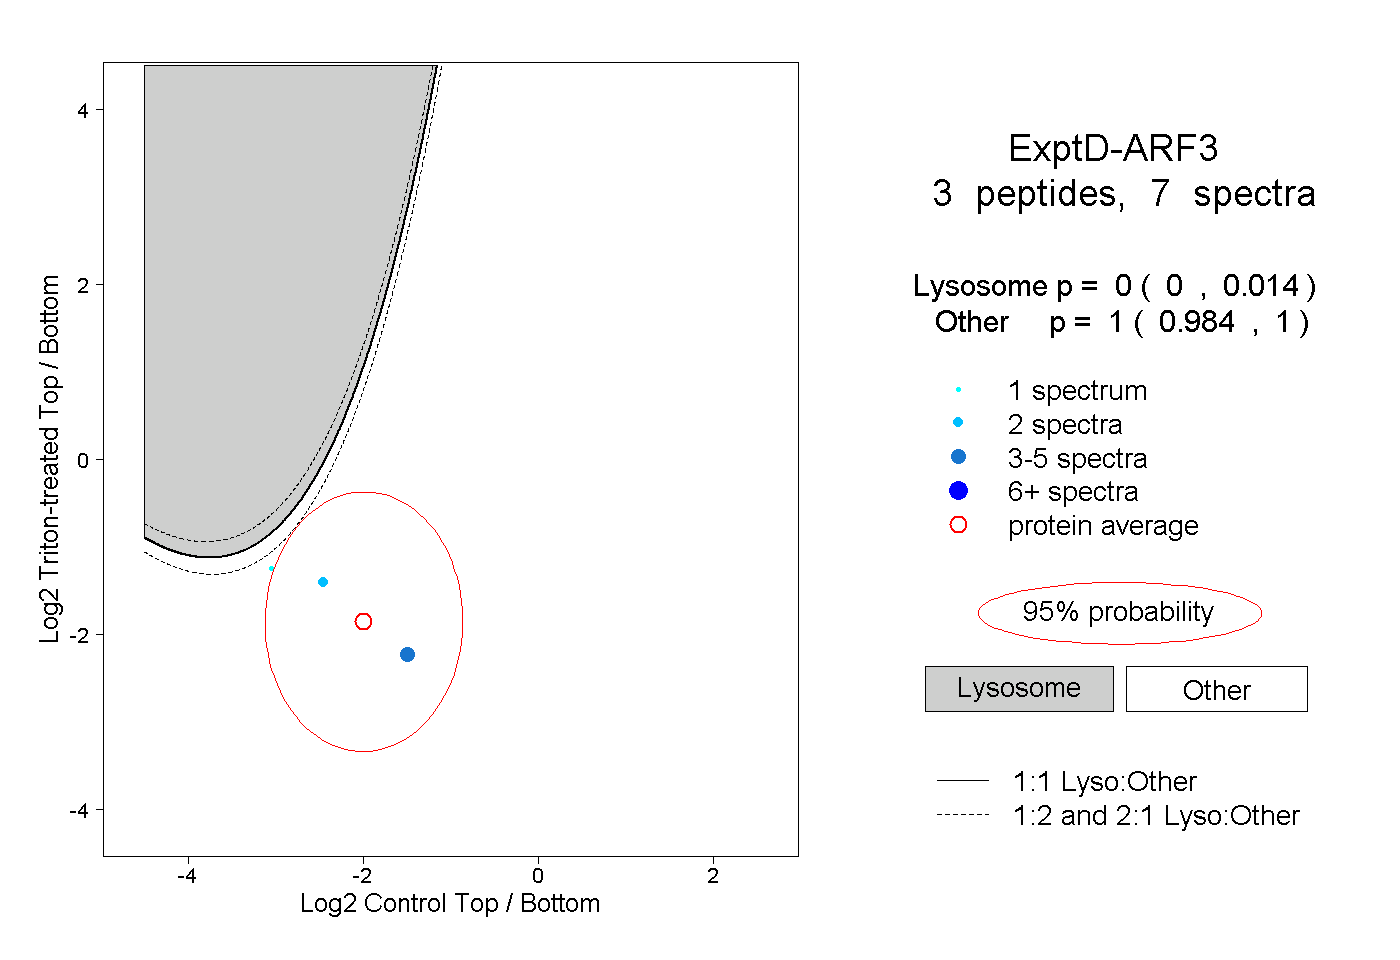 |
0.000 0.000 | 0.014 |
1.000 0.984 | 1.000 |