 5
5peptides
spectra
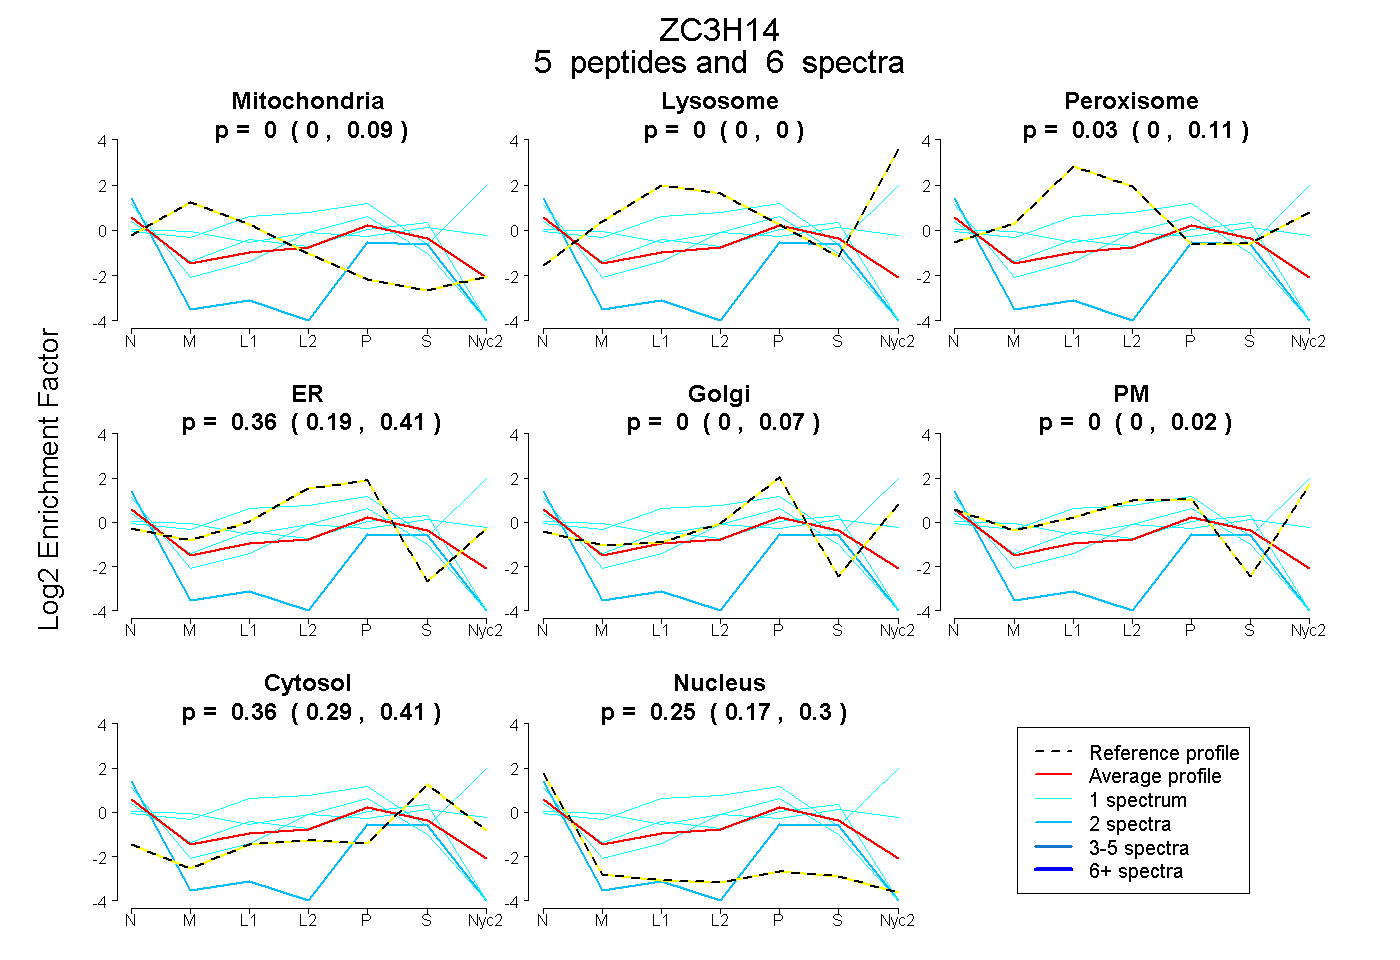
0.000 | 0.089
0.000 | 0.000
0.000 | 0.111
0.186 | 0.406
0.000 | 0.071
0.000 | 0.021
0.286 | 0.412
0.169 | 0.297
| Plot | Mito | Lyso | Perox | ER | Golgi | PM | Cytosol | Nucleus | |||||
| Expt A |
5 peptides |
6 spectra |
|
0.000 0.000 | 0.089 |
0.000 0.000 | 0.000 |
0.032 0.000 | 0.111 |
0.359 0.186 | 0.406 |
0.000 0.000 | 0.071 |
0.000 0.000 | 0.021 |
0.361 0.286 | 0.412 |
0.248 0.169 | 0.297 |
| 1 spectrum, YFPACK | 0.000 | 0.000 | 0.000 | 0.445 | 0.000 | 0.000 | 0.119 | 0.437 | ||
| 1 spectrum, MNIEEENFR | 0.000 | 0.328 | 0.037 | 0.000 | 0.107 | 0.398 | 0.129 | 0.000 | ||
| 1 spectrum, SVTTEPSSLK | 0.132 | 0.000 | 0.012 | 0.220 | 0.000 | 0.000 | 0.408 | 0.228 | ||
| 1 spectrum, TSQEEVLAEMVQGQNR | 0.158 | 0.000 | 0.127 | 0.000 | 0.000 | 0.299 | 0.416 | 0.000 | ||
| 2 spectra, QTLPVAPR | 0.000 | 0.000 | 0.000 | 0.000 | 0.000 | 0.000 | 0.243 | 0.757 |
| Plot | Mito | Lyso or Perox | ER | Golgi | PM | Cytosol | Nucleus | ||||||
| Expt B |
2 peptides |
3 spectra |
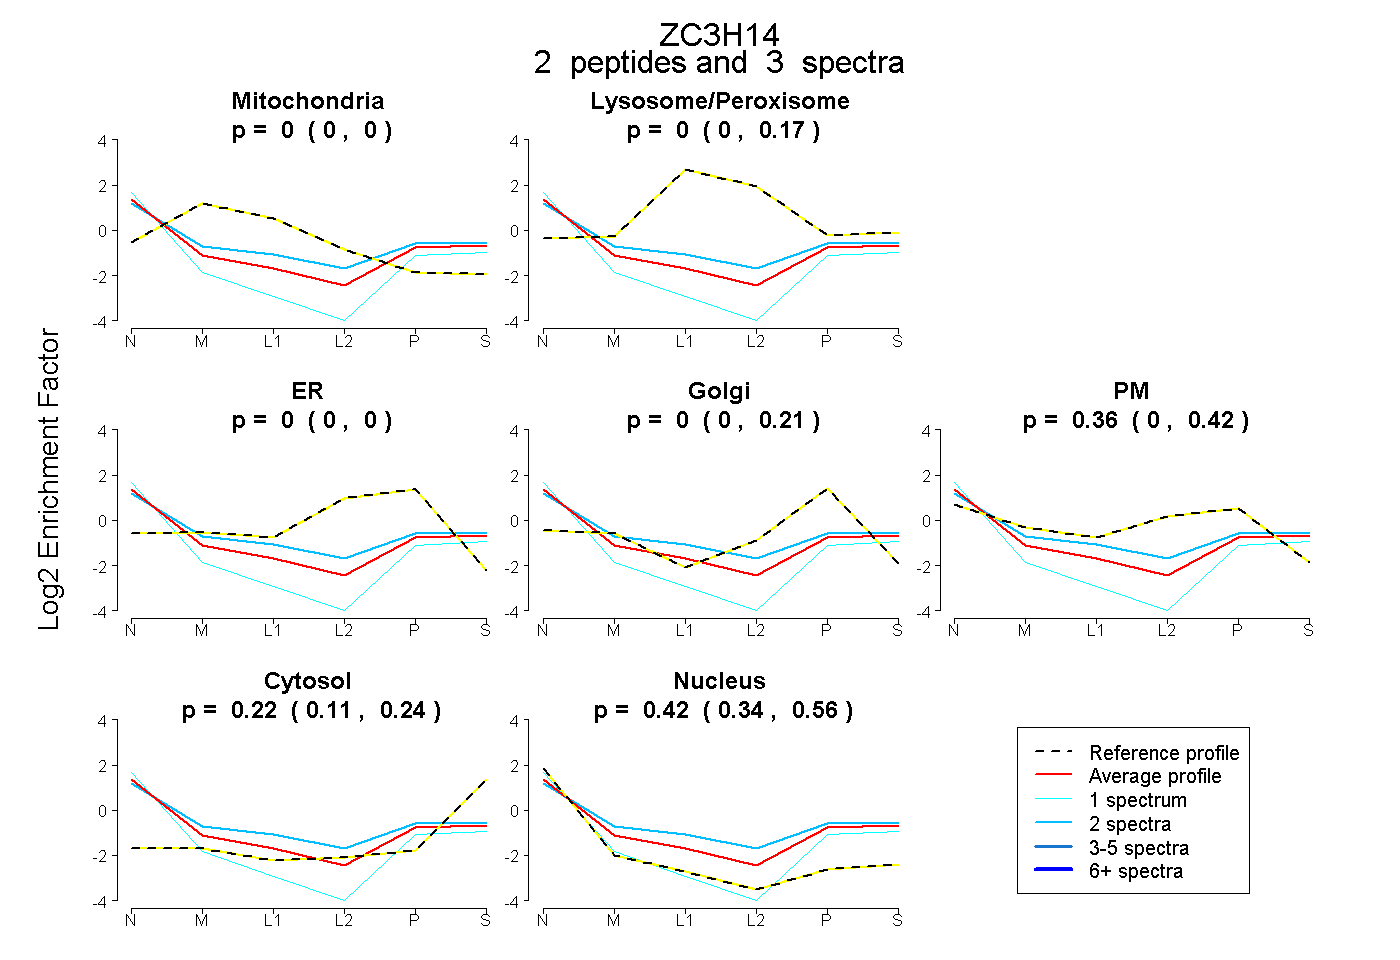 |
0.000 0.000 | 0.000 |
0.000 0.000 | 0.165 |
0.000 0.000 | 0.000 |
0.000 0.000 | 0.210 |
0.357 0.000 | 0.424 |
0.218 0.114 | 0.236 |
0.425 0.339 | 0.559 |