 6
6peptides
spectra
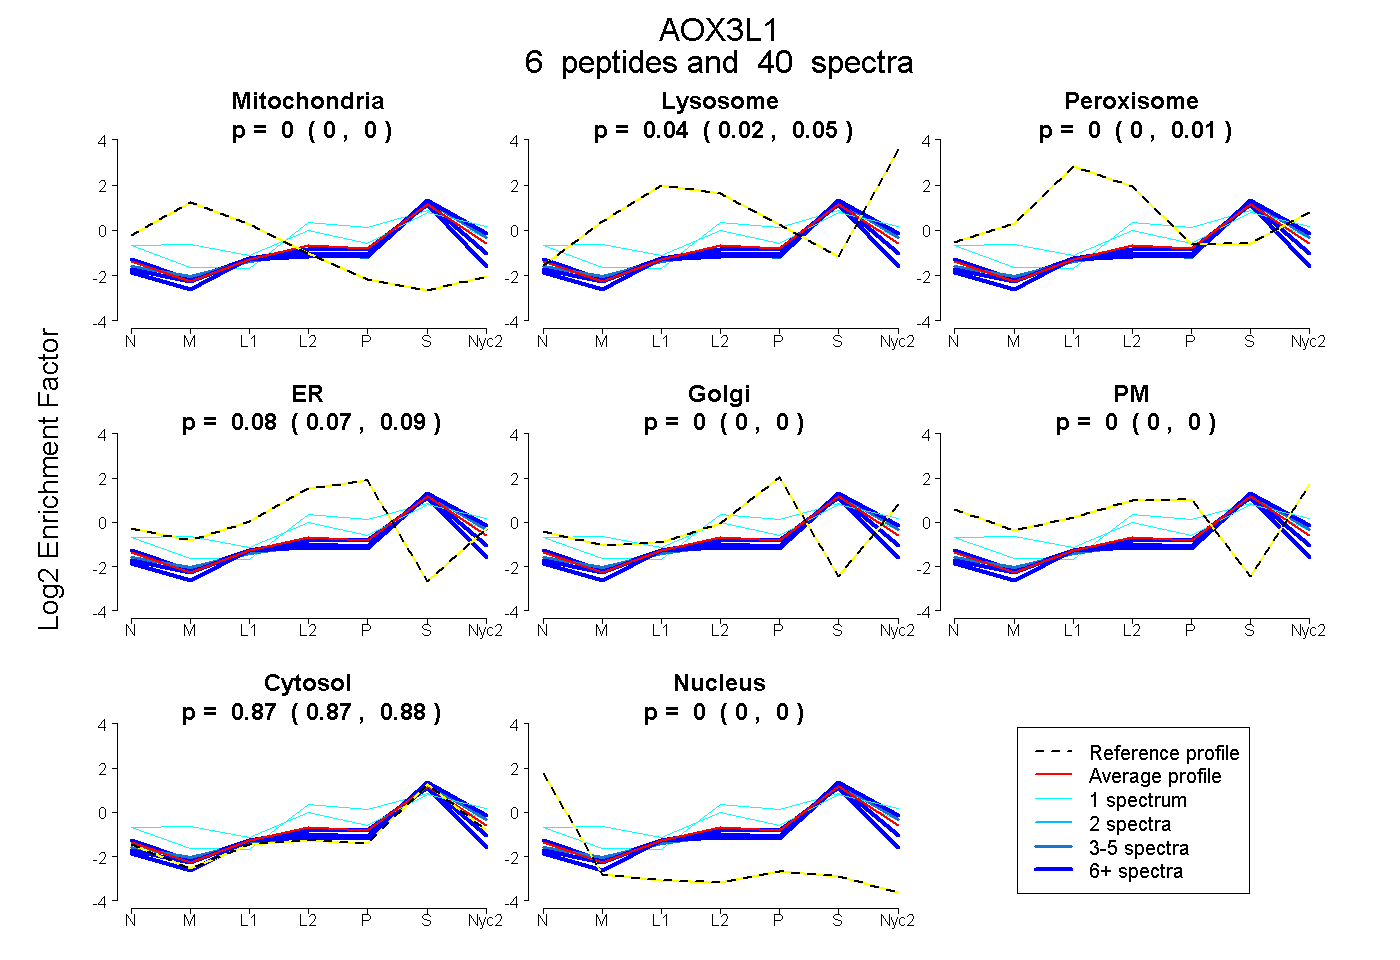
0.000 | 0.000
0.025 | 0.054
0.000 | 0.009
0.069 | 0.094
0.000 | 0.000
0.000 | 0.000
0.865 | 0.881
0.000 | 0.000
6peptides
spectra
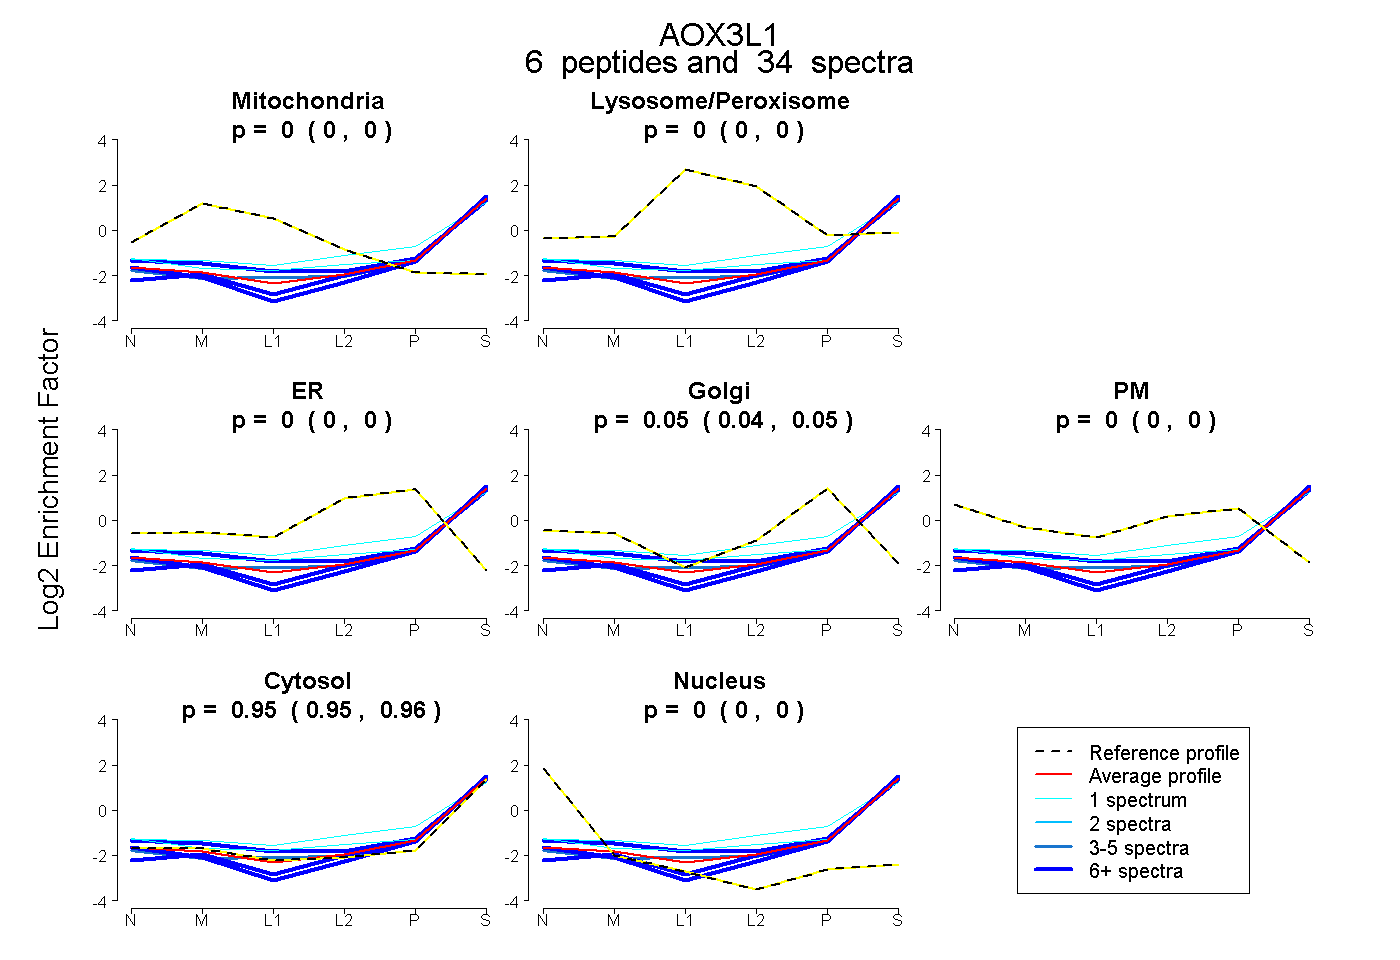
0.000 | 0.000
0.000 | 0.000
0.000 | 0.000
0.043 | 0.052
0.000 | 0.000
0.947 | 0.956
0.000 | 0.000
7peptides
spectra
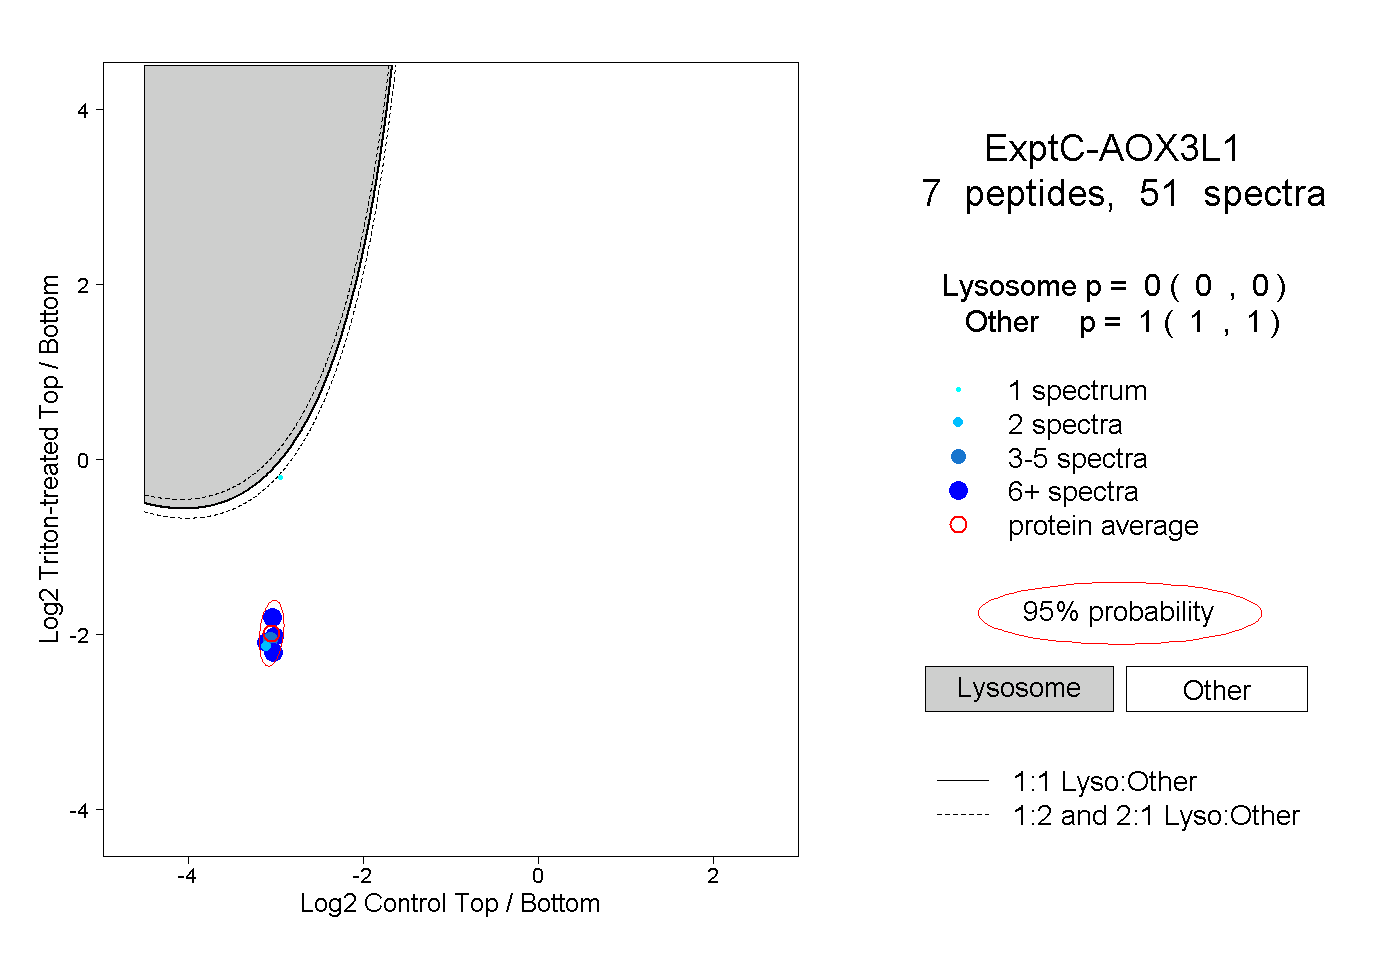
0.000 | 0.000
1.000 | 1.000
2peptides
spectra
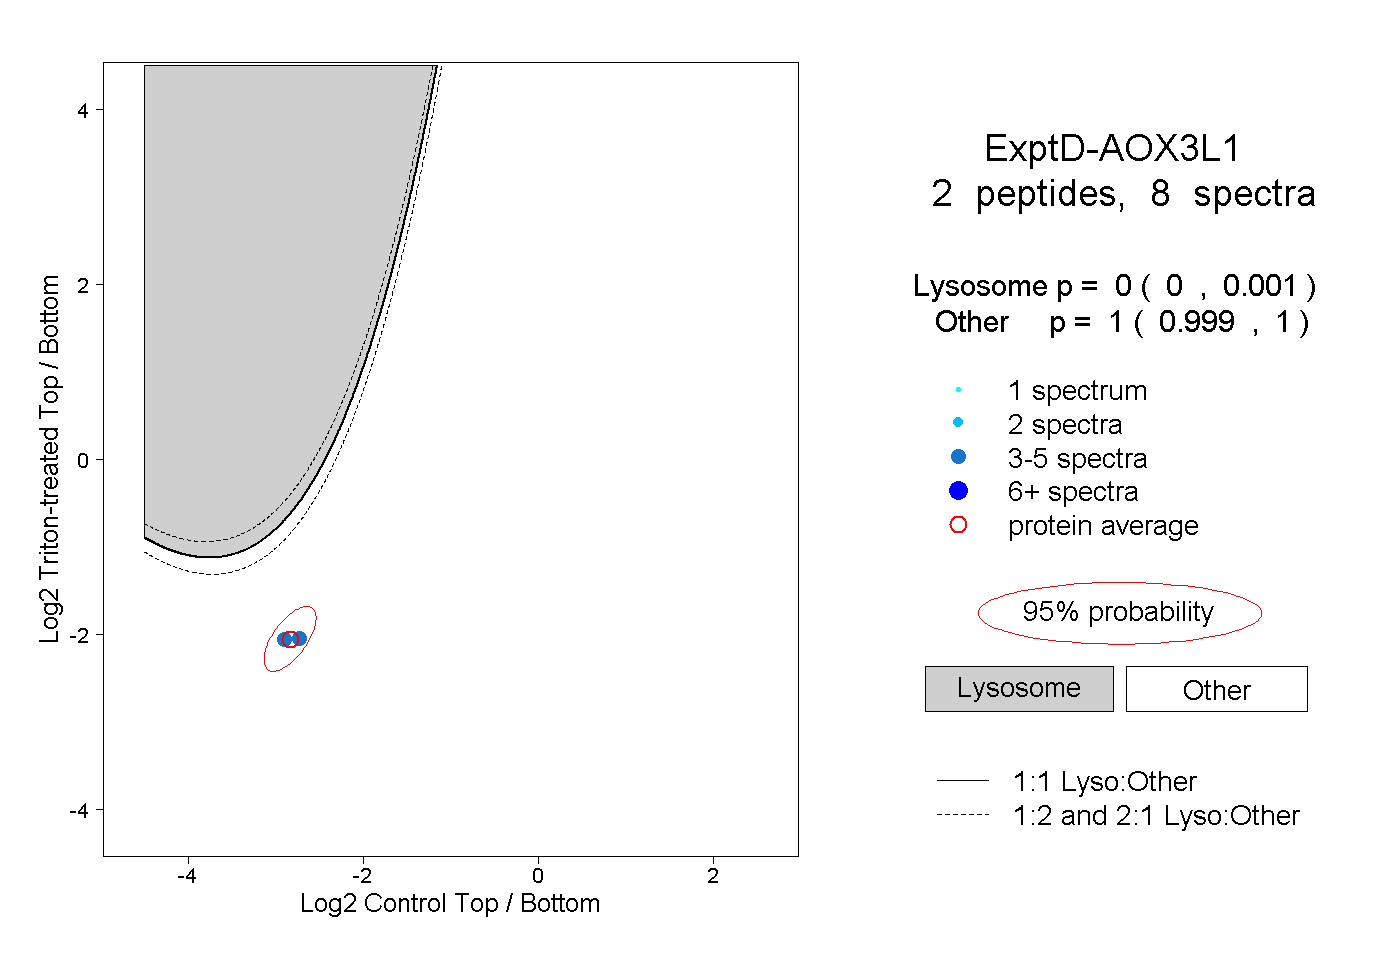
0.000 | 0.001
0.999 | 1.000