 2
2peptides
spectra
0.000 | 0.018
0.000 | 0.004
0.000 | 0.255
0.000 | 0.041
0.000 | 0.236
0.011 | 0.402
0.448 | 0.581
0.000 | 0.000
1peptide
spectrum
NA | NA
NA | NA
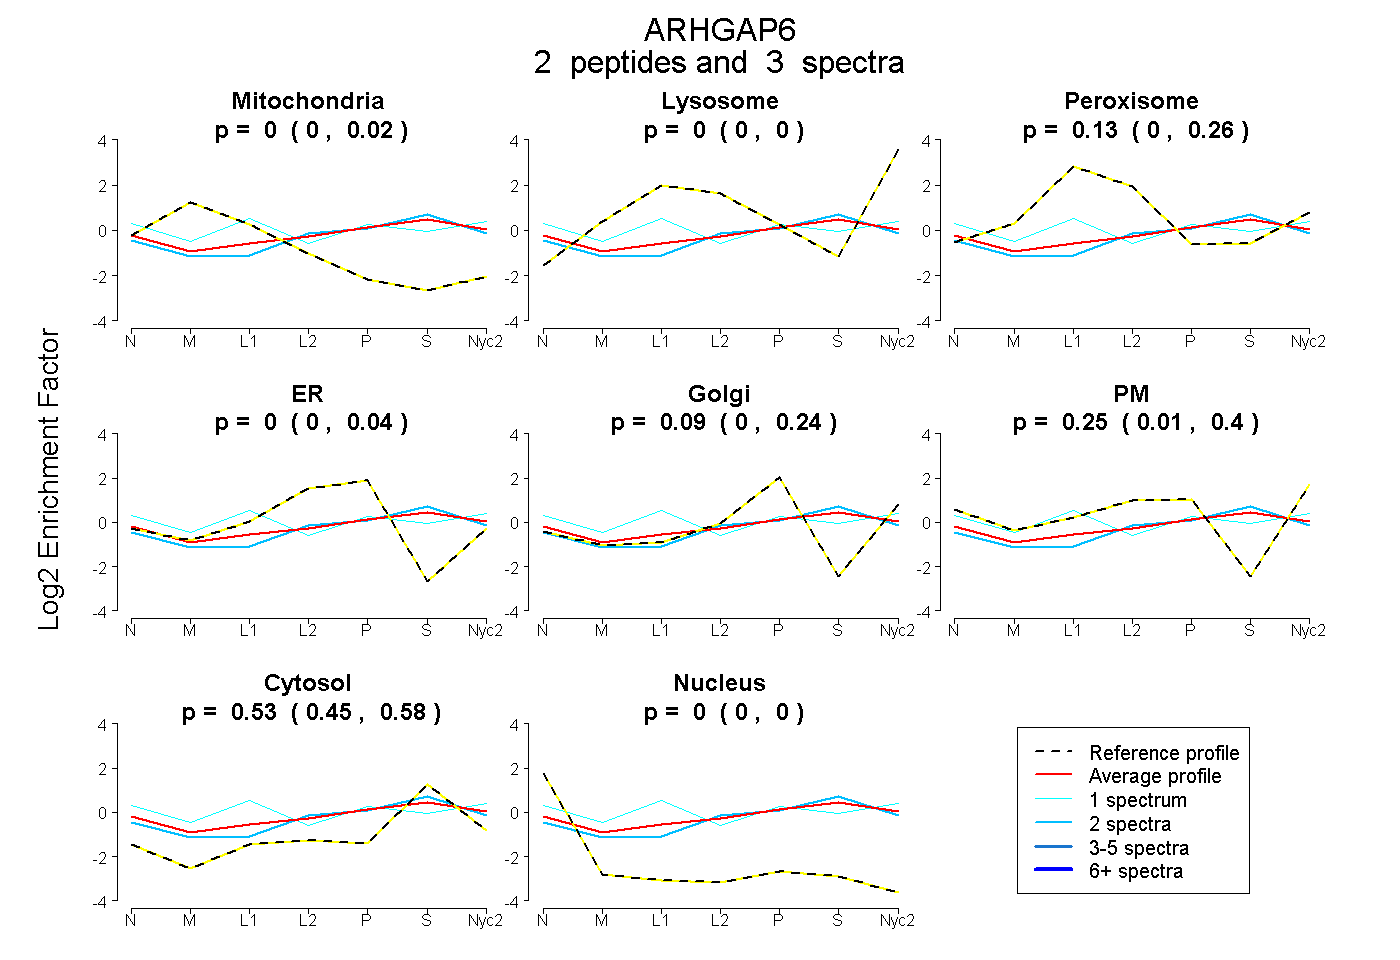
| Plot | Mito | Lyso | Perox | ER | Golgi | PM | Cytosol | Nucleus | |||||
| Expt A |
2 peptides |
3 spectra |
|
0.000 0.000 | 0.018 |
0.000 0.000 | 0.004 |
0.129 0.000 | 0.255 |
0.000 0.000 | 0.041 |
0.091 0.000 | 0.236 |
0.255 0.011 | 0.402 |
0.525 0.448 | 0.581 |
0.000 0.000 | 0.000 |
||
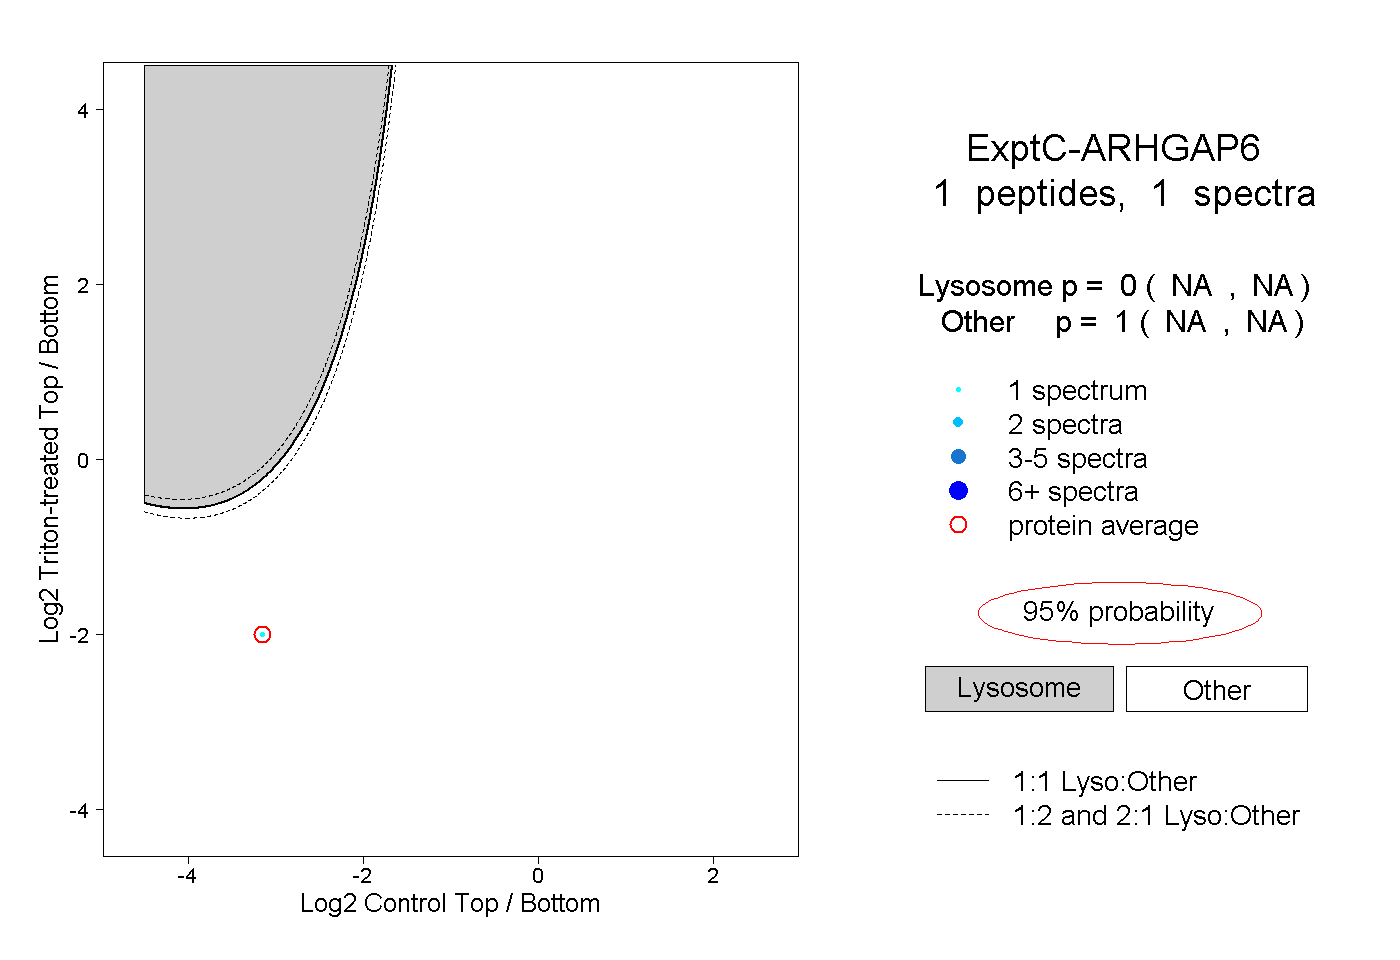
| Plot | Lyso | Other | |||||||||||
| Expt C |
1 peptide |
1 spectrum |
|
0.000 NA | NA |
1.000 NA | NA |
| 1 spectrum, DGQEVTGNK | 0.000 | 1.000 |