 10
10peptides
spectra
0.000 | 0.000
0.000 | 0.000
0.000 | 0.000
0.000 | 0.000
0.000 | 0.000
0.000 | 0.000
1.000 | 1.000
0.000 | 0.000
| Plot | Mito | Lyso | Perox | ER | Golgi | PM | Cytosol | Nucleus | |||||
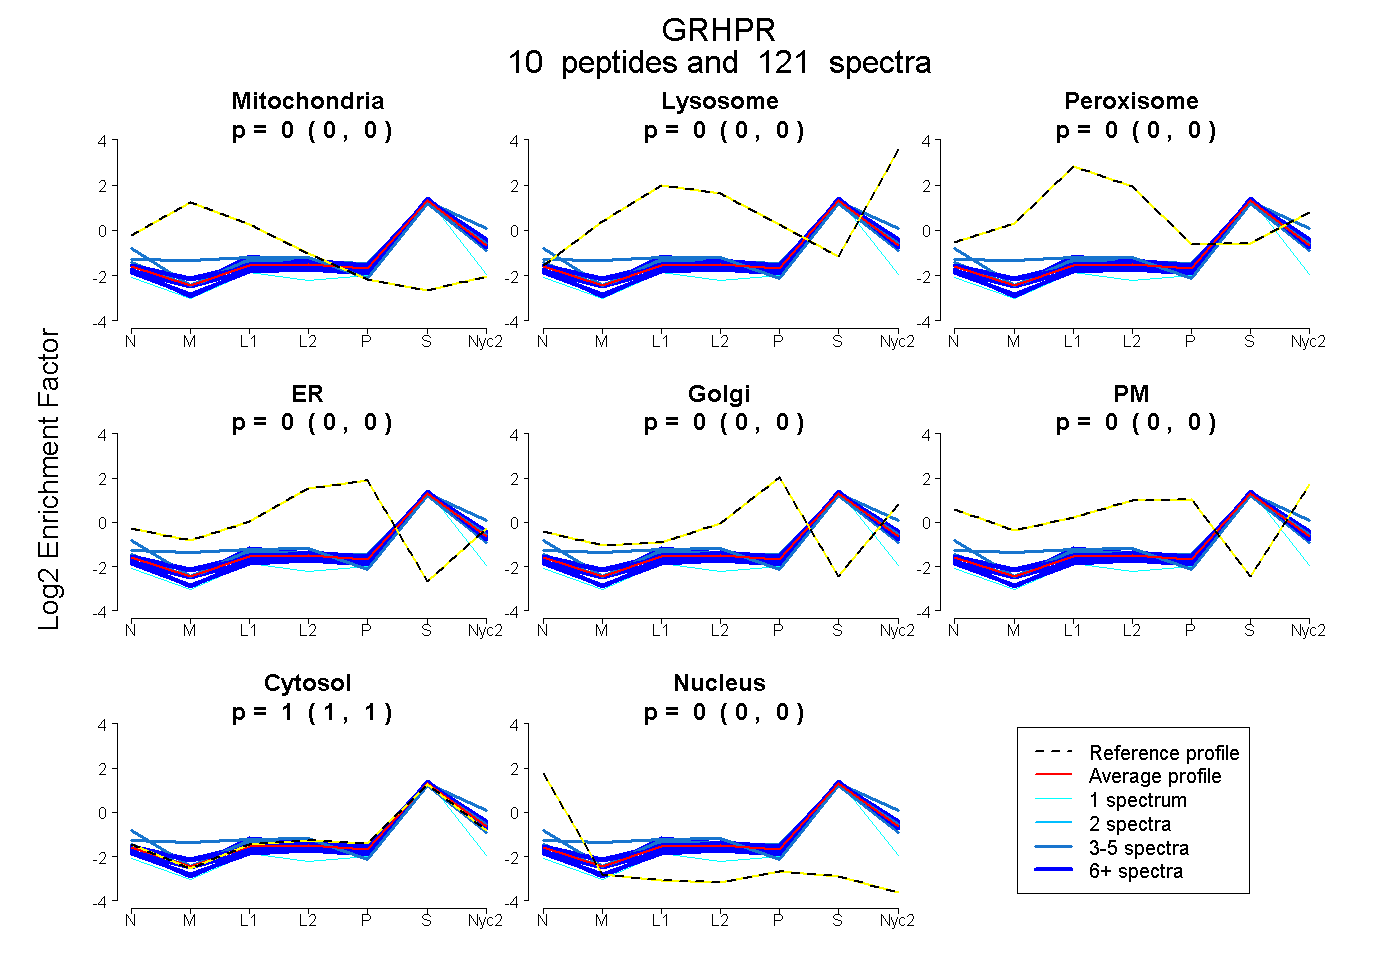
| Expt A |
10 peptides |
121 spectra |
|
0.000 0.000 | 0.000 |
0.000 0.000 | 0.000 |
0.000 0.000 | 0.000 |
0.000 0.000 | 0.000 |
0.000 0.000 | 0.000 |
0.000 0.000 | 0.000 |
1.000 1.000 | 1.000 |
0.000 0.000 | 0.000 |
| 8 spectra, LLDAAGANLR | 0.000 | 0.018 | 0.000 | 0.000 | 0.000 | 0.000 | 0.982 | 0.000 | ||
| 24 spectra, IGQAIAR | 0.005 | 0.035 | 0.000 | 0.000 | 0.000 | 0.000 | 0.961 | 0.000 | ||
| 3 spectra, VISTLSVGVDHLALDEIK | 0.136 | 0.032 | 0.000 | 0.000 | 0.000 | 0.000 | 0.833 | 0.000 | ||
| 25 spectra, VFVTGPLPAQGR | 0.000 | 0.000 | 0.000 | 0.000 | 0.000 | 0.000 | 0.998 | 0.002 | ||
| 21 spectra, LKPFGVQR | 0.000 | 0.000 | 0.000 | 0.000 | 0.000 | 0.000 | 1.000 | 0.000 | ||
| 1 spectrum, DLEQGVAGAYGLLCR | 0.000 | 0.000 | 0.000 | 0.000 | 0.000 | 0.000 | 0.913 | 0.087 | ||
| 22 spectra, FLYTGR | 0.000 | 0.000 | 0.000 | 0.000 | 0.000 | 0.000 | 1.000 | 0.000 | ||
| 3 spectra, LPEAIEEVK | 0.000 | 0.000 | 0.037 | 0.000 | 0.000 | 0.000 | 0.899 | 0.064 | ||
| 10 spectra, NTAVFINISR | 0.000 | 0.030 | 0.000 | 0.000 | 0.000 | 0.000 | 0.970 | 0.000 | ||
| 4 spectra, GEPMPSELK | 0.000 | 0.063 | 0.000 | 0.000 | 0.000 | 0.000 | 0.937 | 0.000 |
| Plot | Mito | Lyso or Perox | ER | Golgi | PM | Cytosol | Nucleus | ||||||
| Expt B |
10 peptides |
59 spectra |
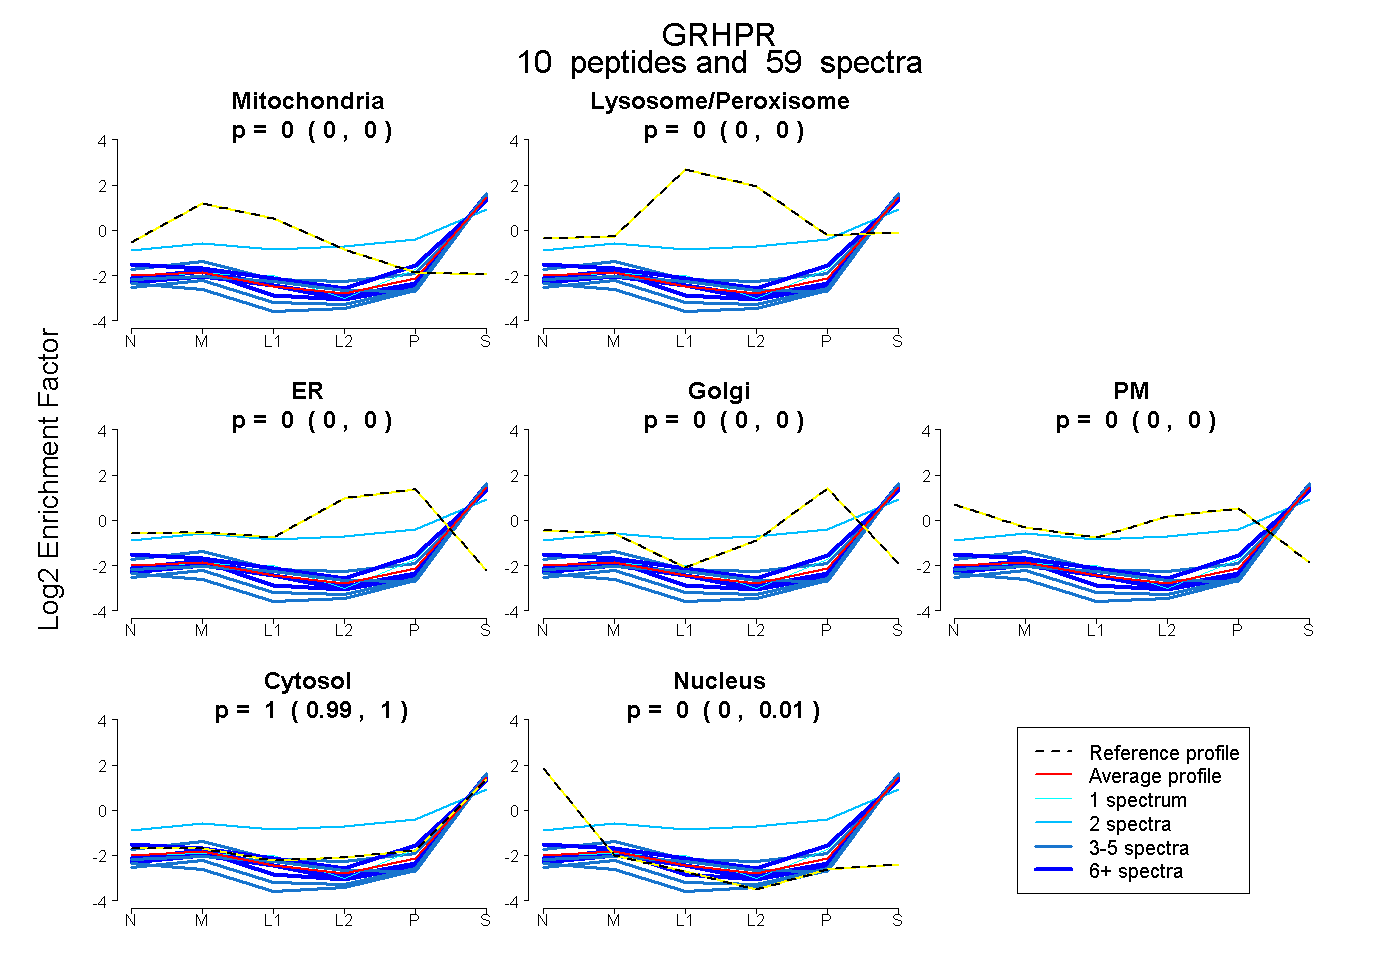 |
0.000 0.000 | 0.000 |
0.000 0.000 | 0.000 |
0.000 0.000 | 0.000 |
0.000 0.000 | 0.000 |
0.000 0.000 | 0.000 |
0.999 0.993 | 1.000 |
0.001 0.000 | 0.006 |
|||
| Plot | Lyso | Other | |||||||||||
| Expt C |
11 peptides |
110 spectra |
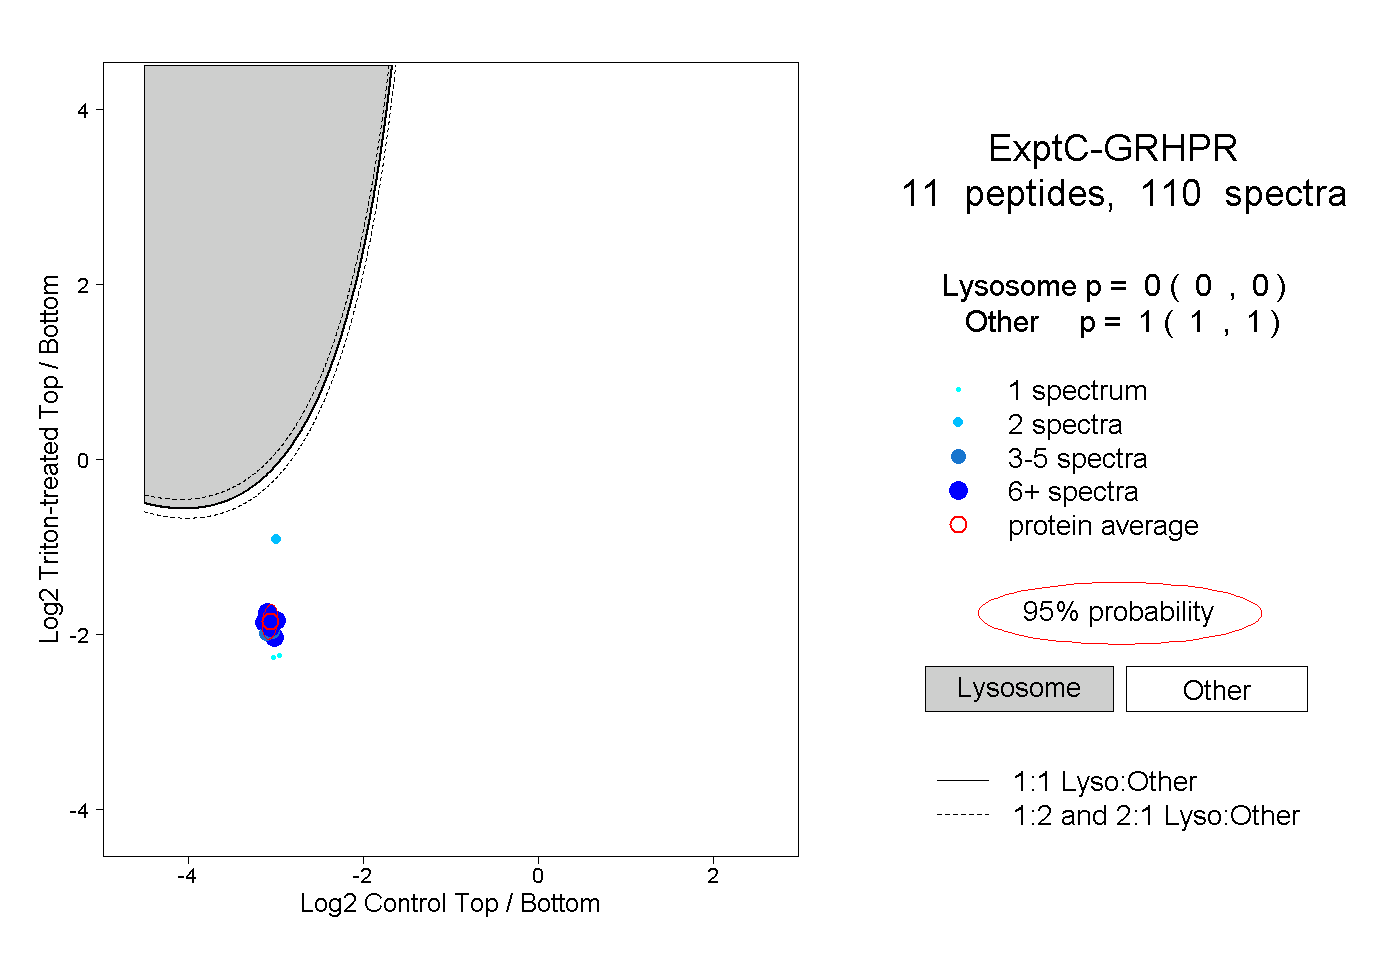 |
0.000 0.000 | 0.000 |
1.000 1.000 | 1.000 |
||||||||
| Plot | Lyso | Other | |||||||||||
| Expt D |
5 peptides |
8 spectra |
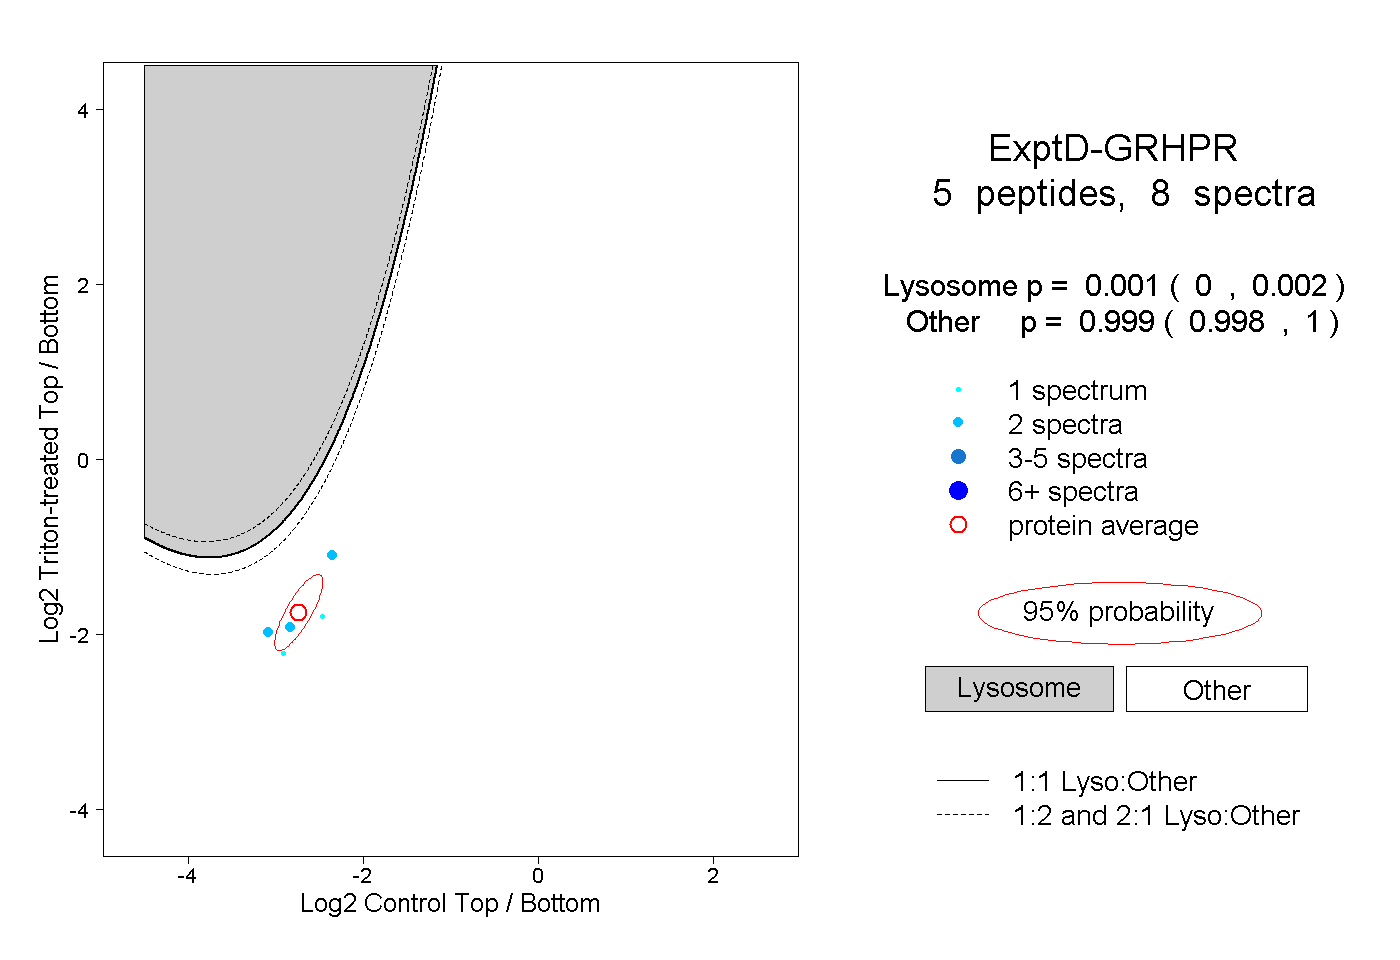 |
0.001 0.000 | 0.002 |
0.999 0.998 | 1.000 |