 24
24peptides
spectra
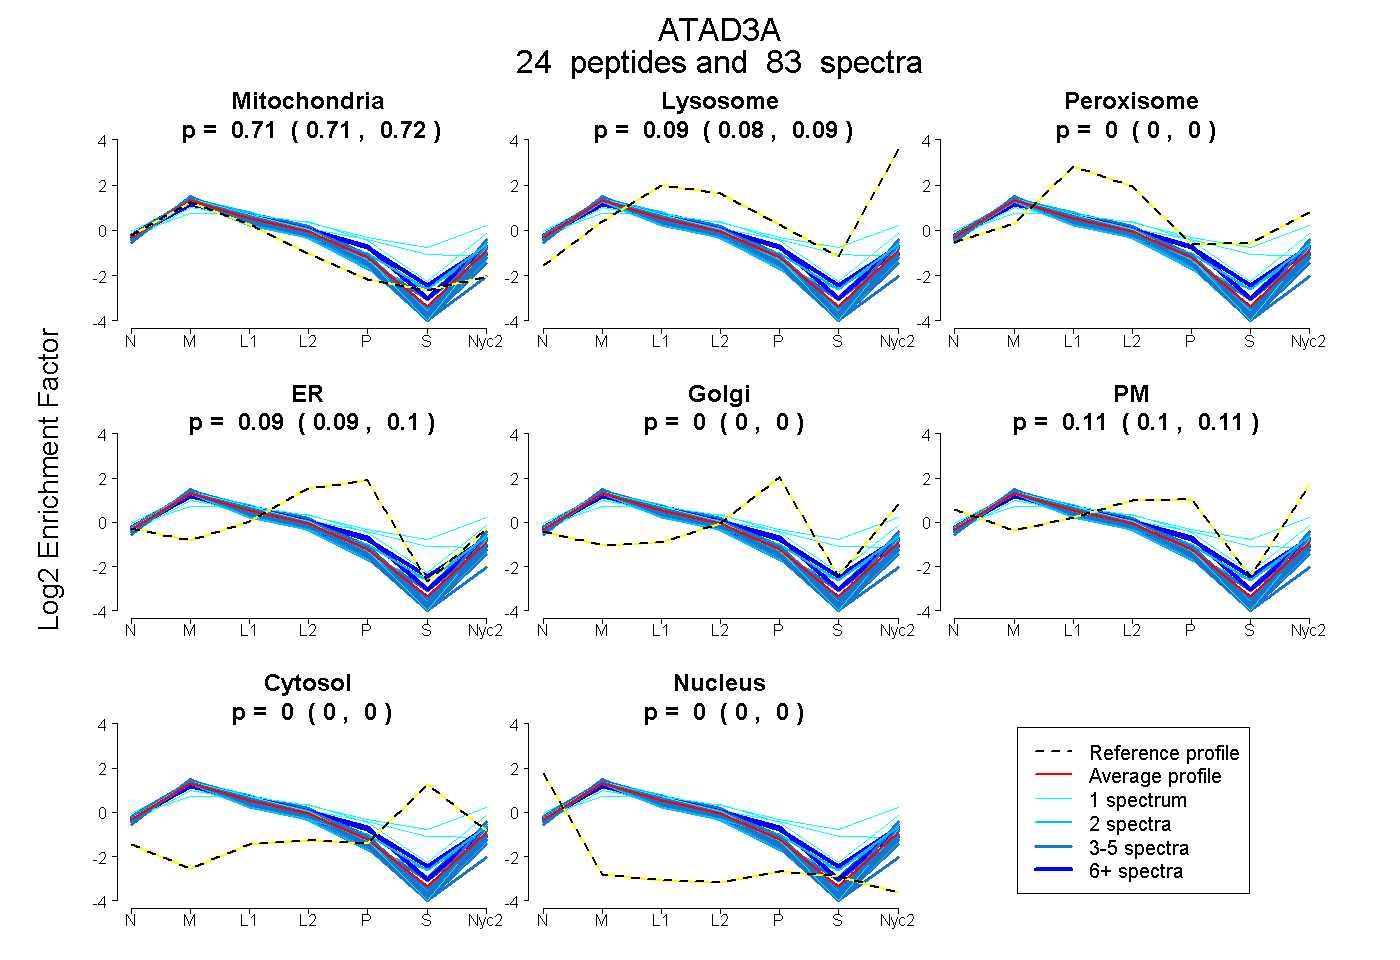
0.710 | 0.715
0.082 | 0.088
0.000 | 0.000
0.088 | 0.099
0.000 | 0.000
0.101 | 0.113
0.000 | 0.000
0.000 | 0.000
12peptides
spectra
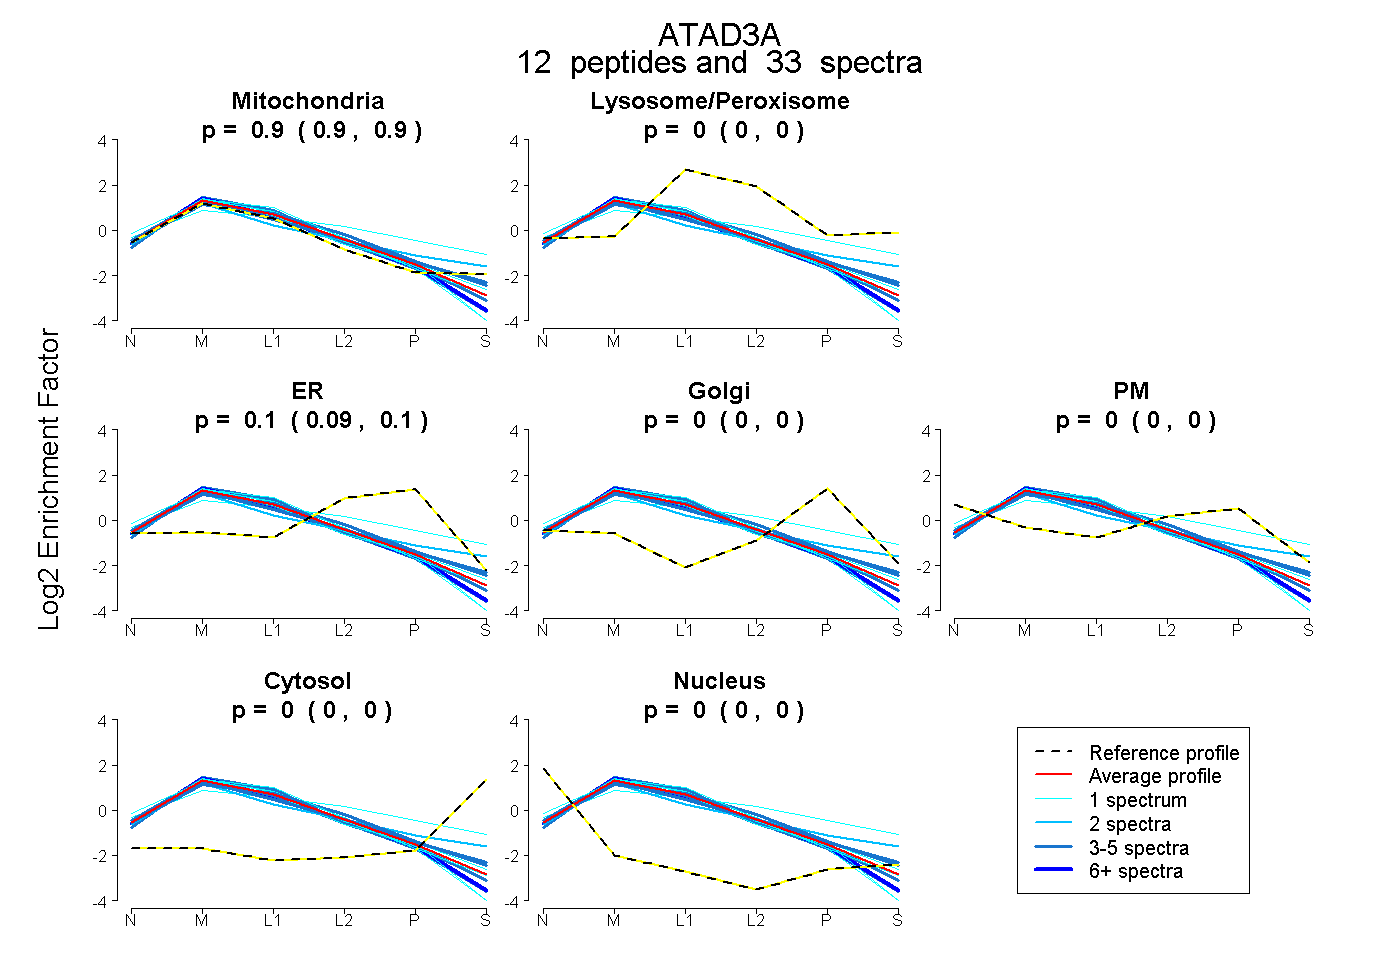
0.895 | 0.905
0.000 | 0.000
0.095 | 0.104
0.000 | 0.000
0.000 | 0.000
0.000 | 0.000
0.000 | 0.000
34peptides
spectra
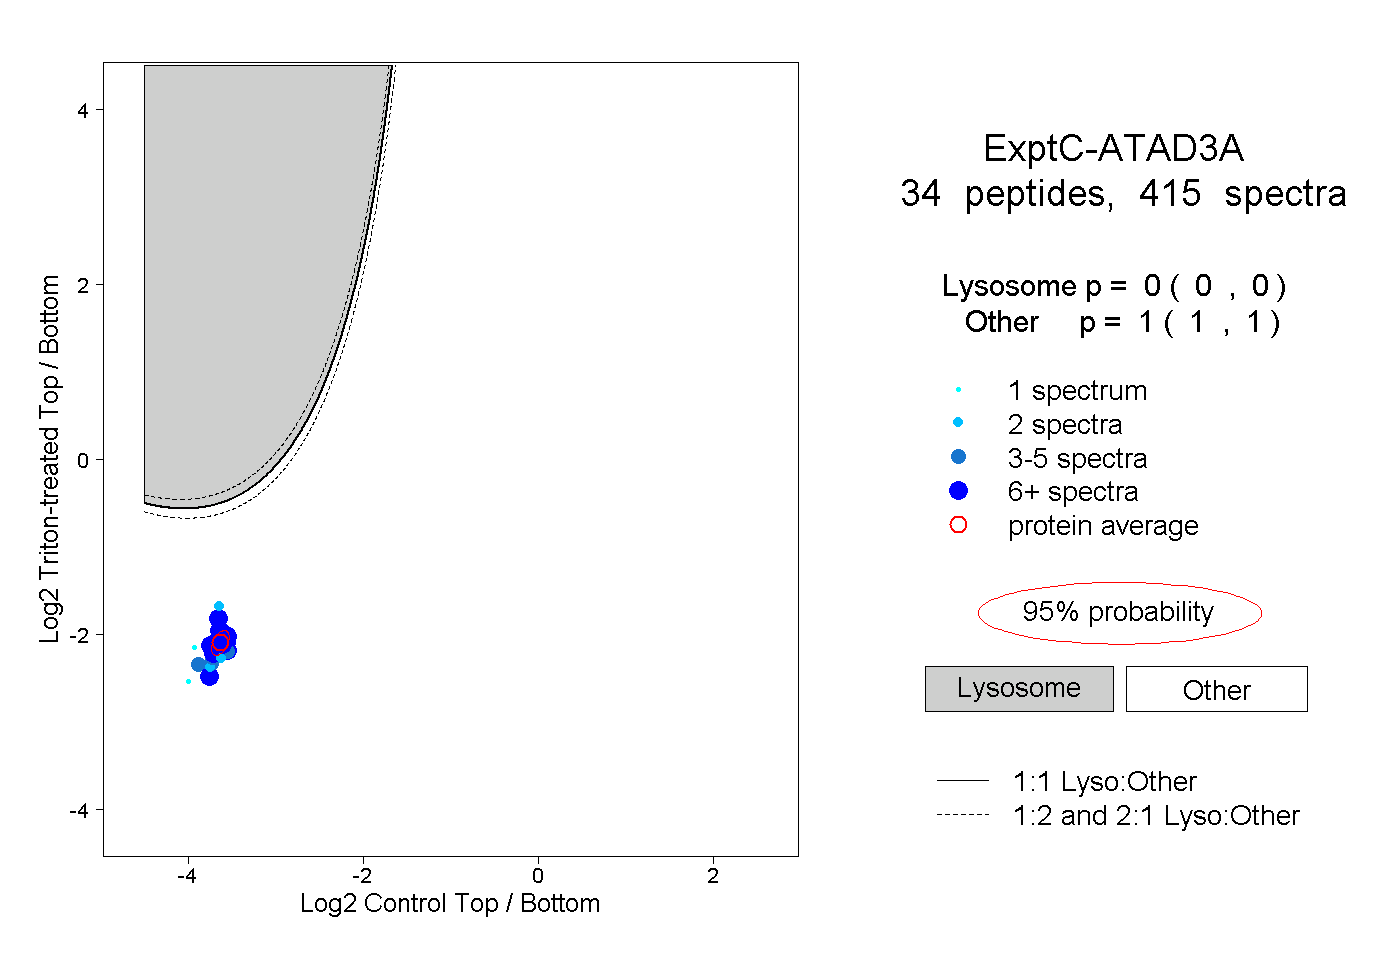
0.000 | 0.000
1.000 | 1.000
13peptides
spectra
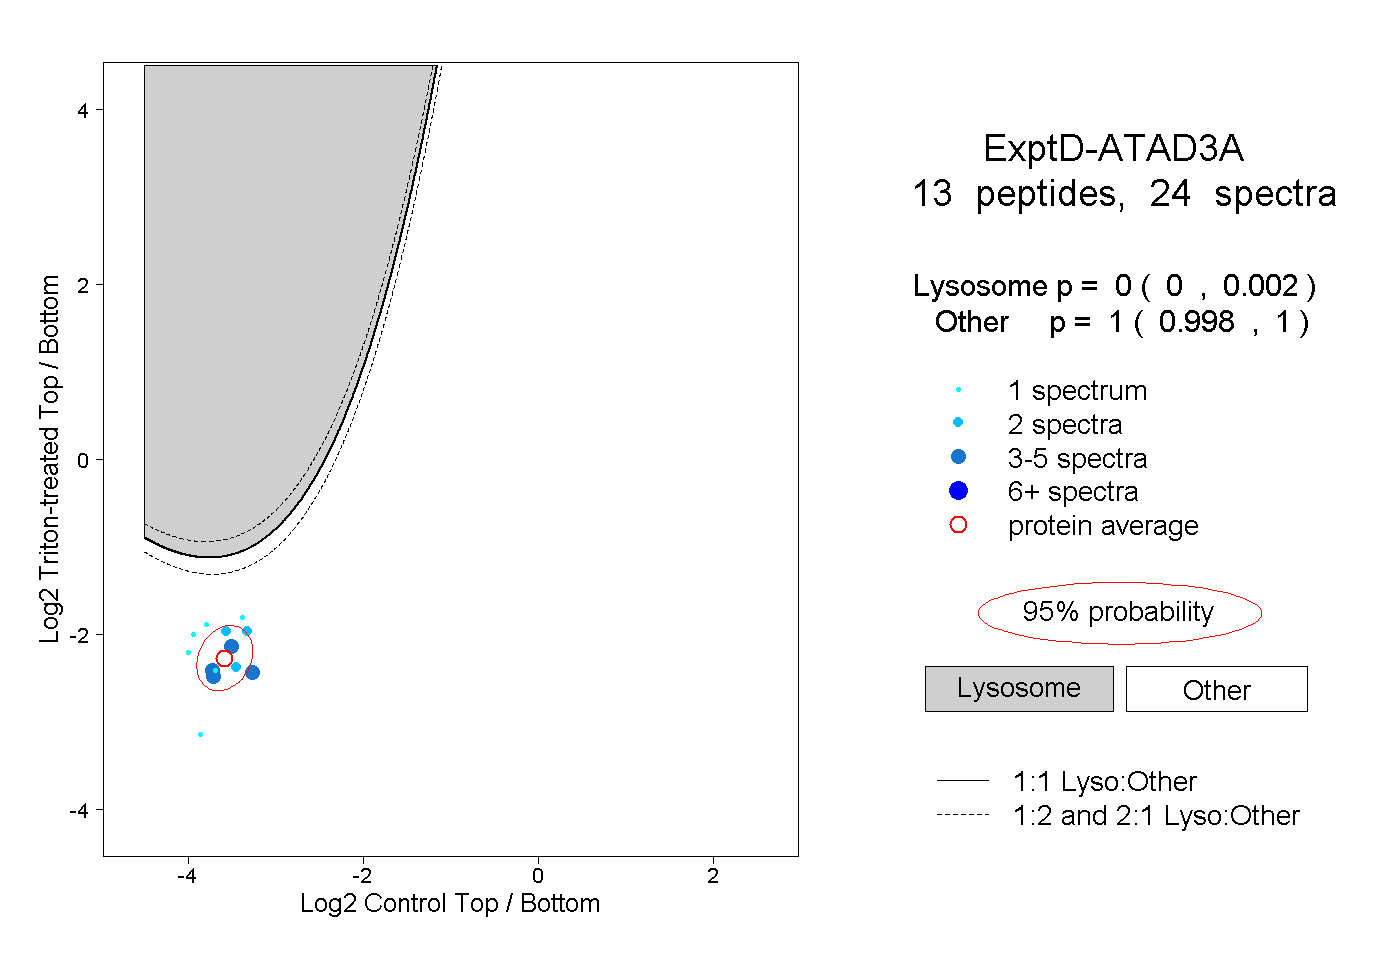
0.000 | 0.002
0.998 | 1.000