 22
22peptides
spectra
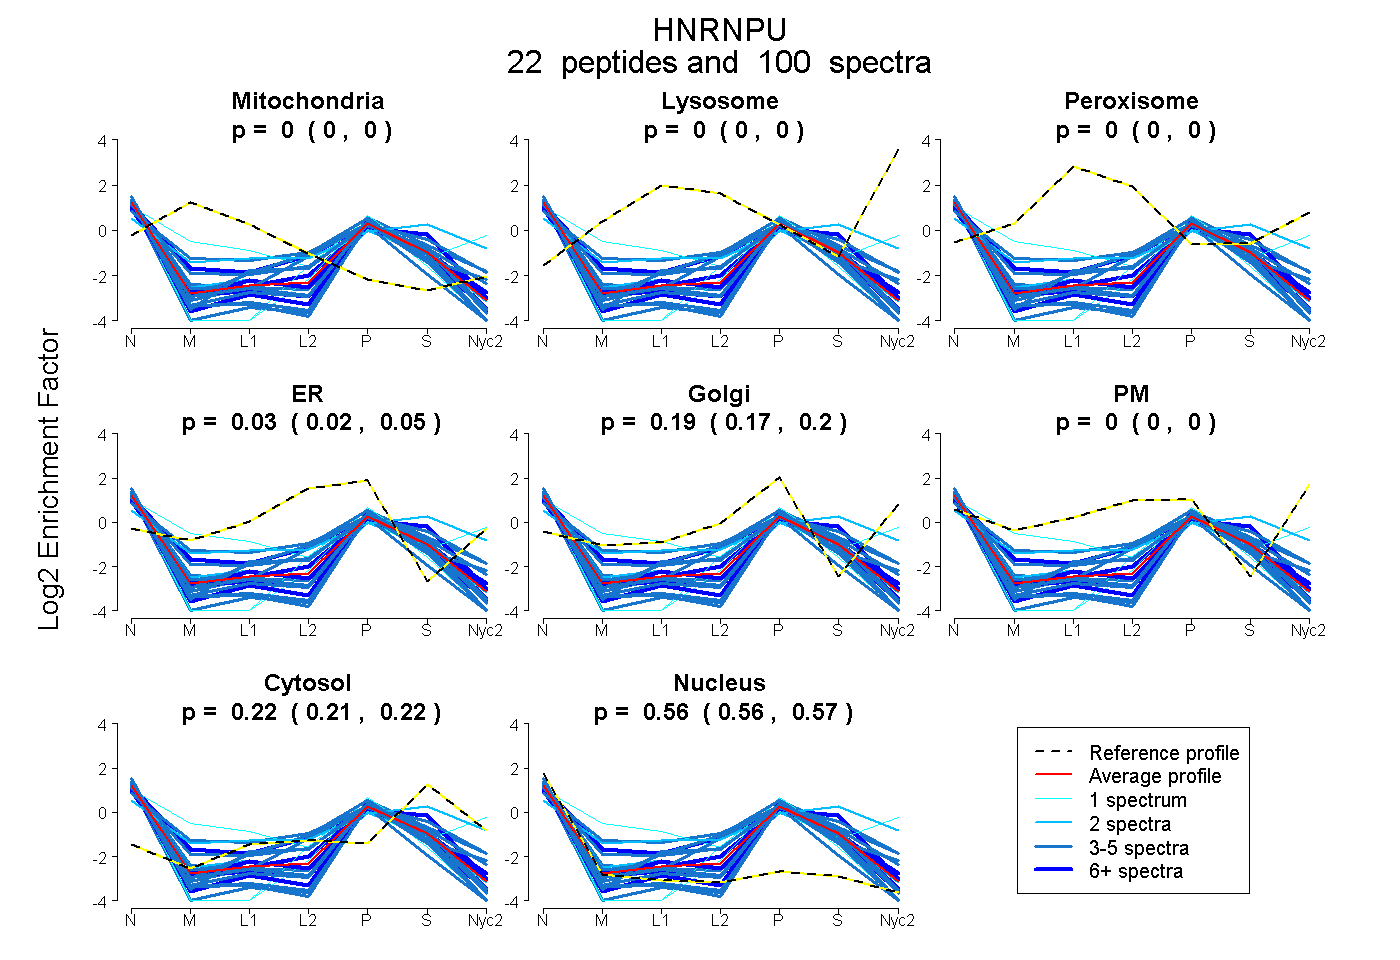
0.000 | 0.000
0.000 | 0.000
0.000 | 0.000
0.016 | 0.046
0.171 | 0.202
0.000 | 0.000
0.212 | 0.219
0.560 | 0.566
9peptides
spectra

0.000 | 0.000
0.000 | 0.000
0.000 | 0.000
0.300 | 0.374
0.211 | 0.290
0.081 | 0.102
0.300 | 0.322
6peptides
spectra
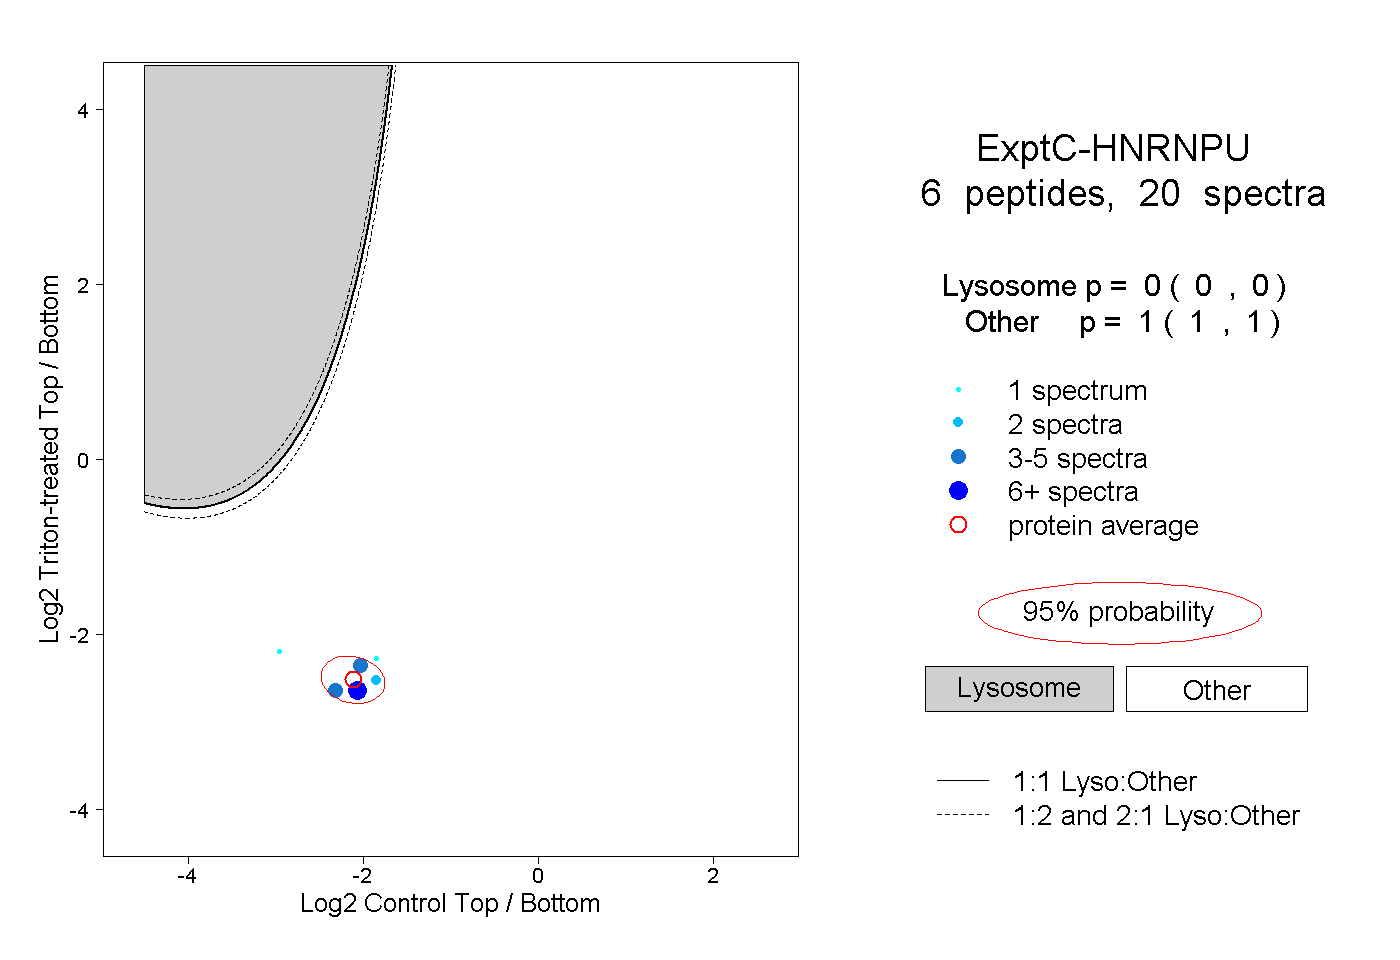
0.000 | 0.000
1.000 | 1.000
3peptides
spectra
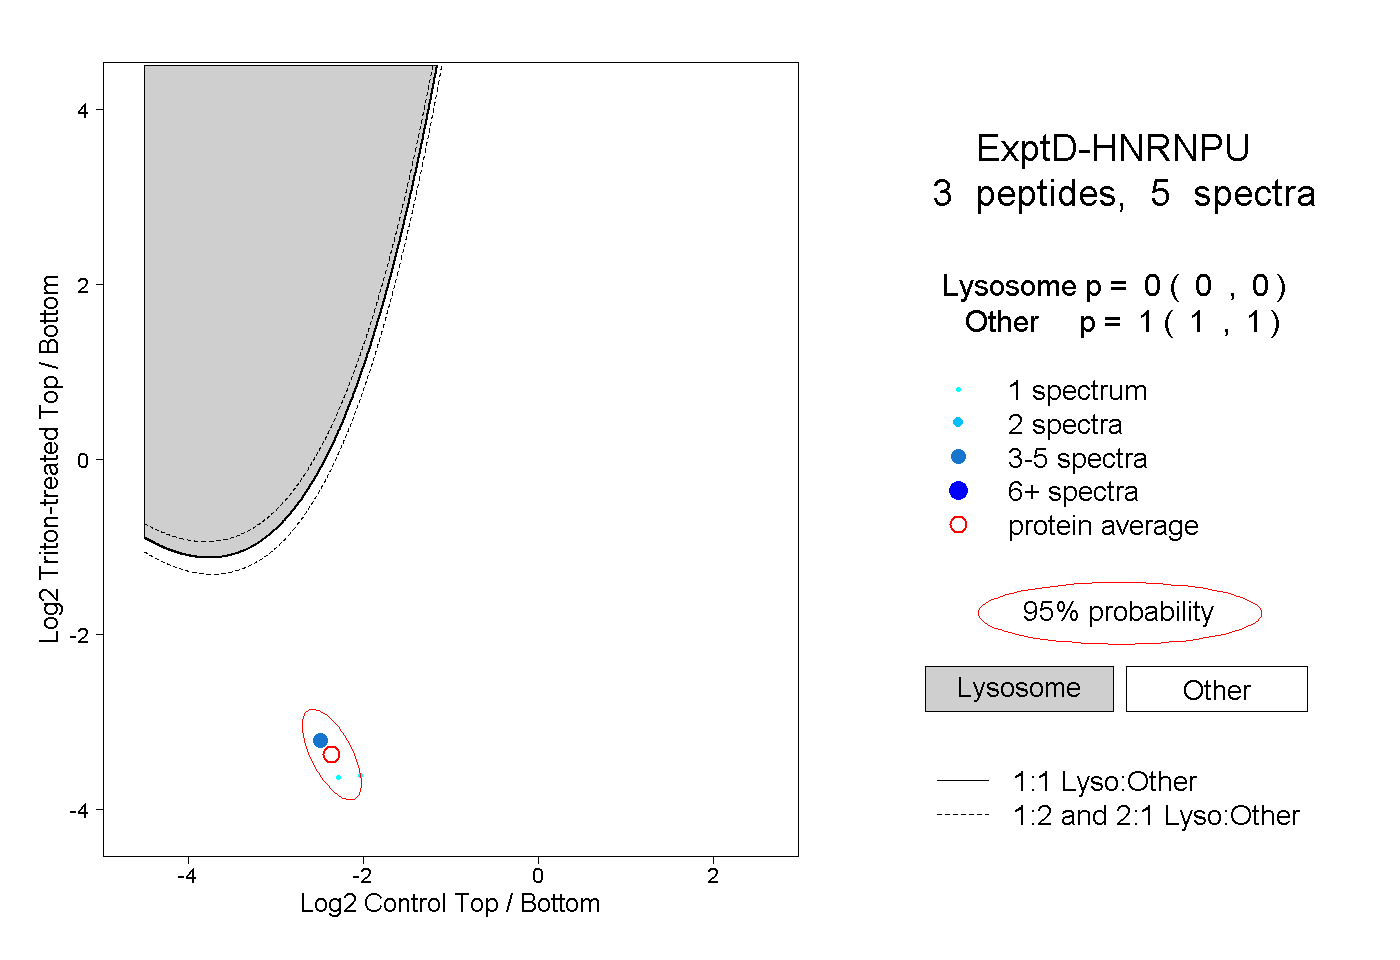
0.000 | 0.000
1.000 | 1.000