 2
2peptides
spectra
0.000 | 0.000
0.613 | 0.810
0.000 | 0.000
0.000 | 0.000
0.000 | 0.040
0.116 | 0.368
0.000 | 0.000
0.000 | 0.000
9peptides
spectra

0.001 | 0.374
0.621 | 0.999
| Plot | Mito | Lyso | Perox | ER | Golgi | PM | Cytosol | Nucleus | |||||
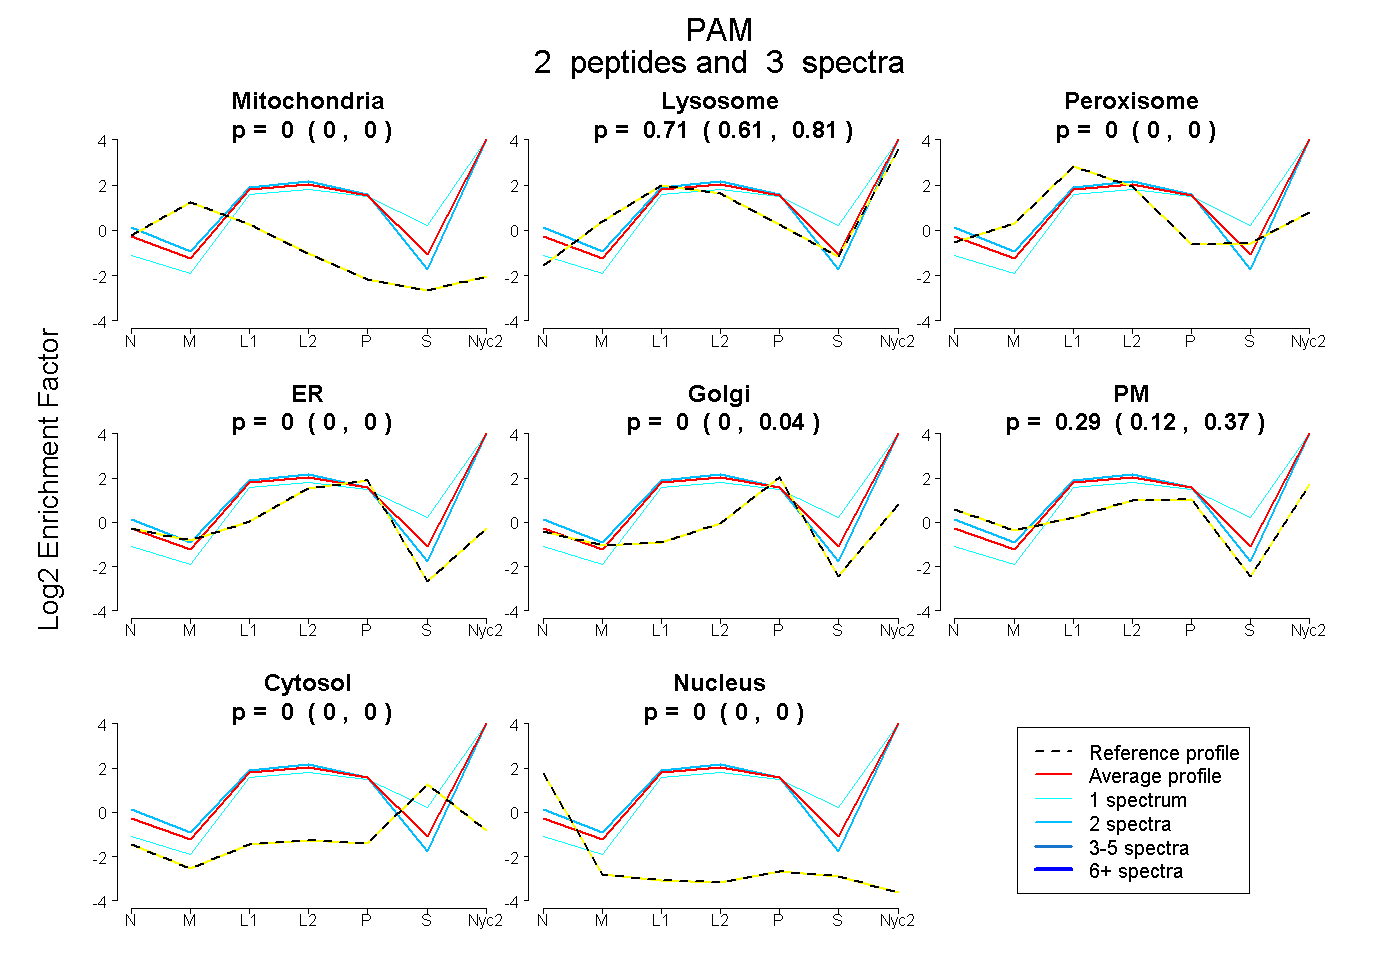
| Expt A |
2 peptides |
3 spectra |
|
0.000 0.000 | 0.000 |
0.714 0.613 | 0.810 |
0.000 0.000 | 0.000 |
0.000 0.000 | 0.000 |
0.000 0.000 | 0.040 |
0.286 0.116 | 0.368 |
0.000 0.000 | 0.000 |
0.000 0.000 | 0.000 |
||
| Plot | Lyso | Other | |||||||||||
| Expt C |
9 peptides |
21 spectra |
|
0.017 0.001 | 0.374 |
0.983 0.621 | 0.999 |