13
13peptides
spectra
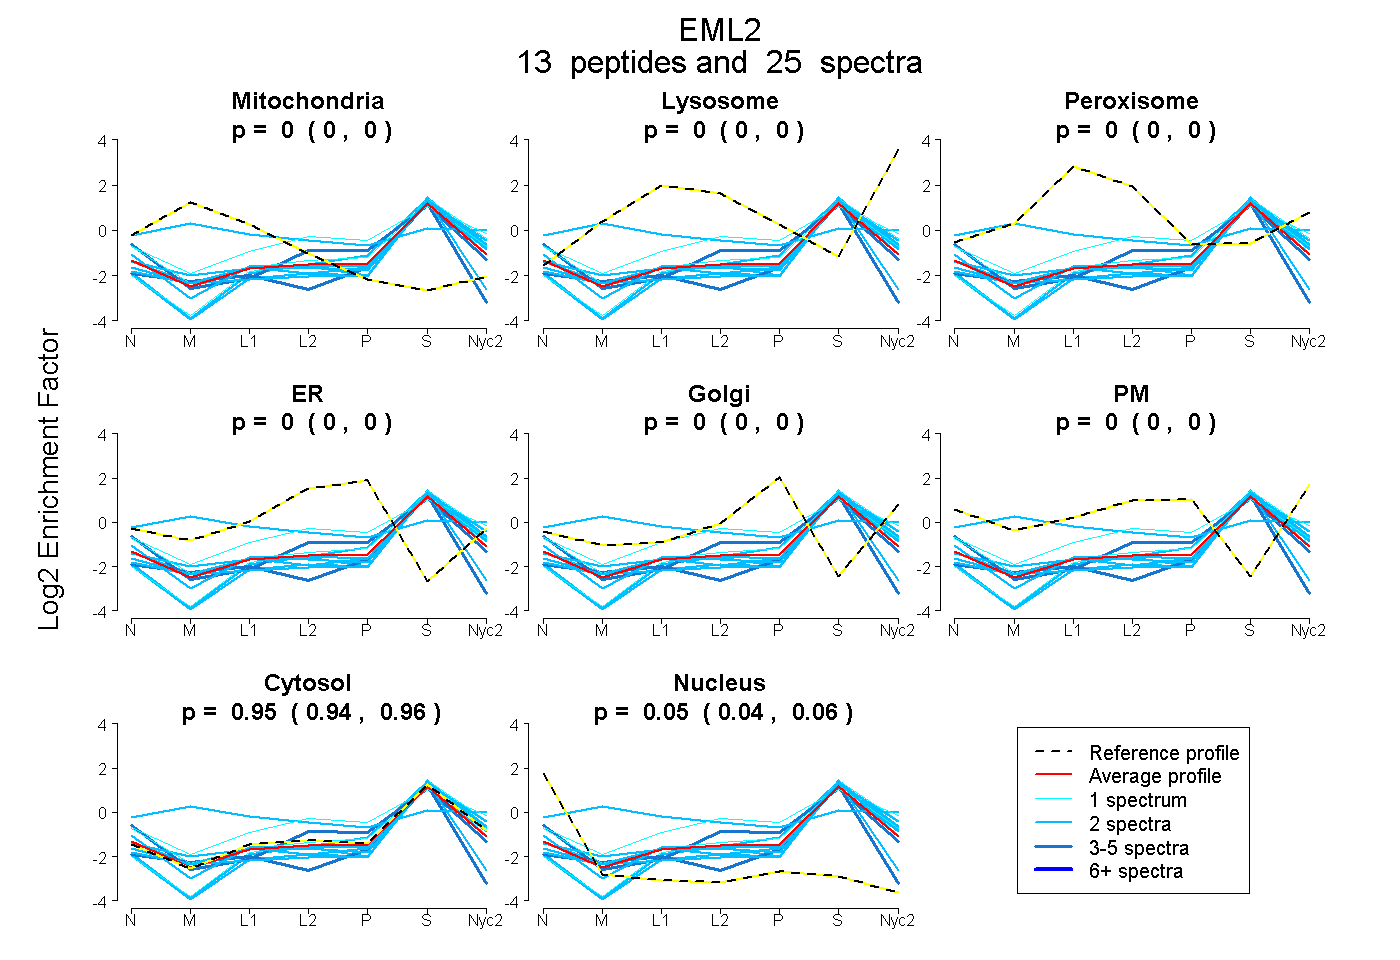
0.000 | 0.000
0.000 | 0.000
0.000 | 0.000
0.000 | 0.000
0.000 | 0.000
0.000 | 0.000
0.937 | 0.957
0.040 | 0.060
5peptides
spectra
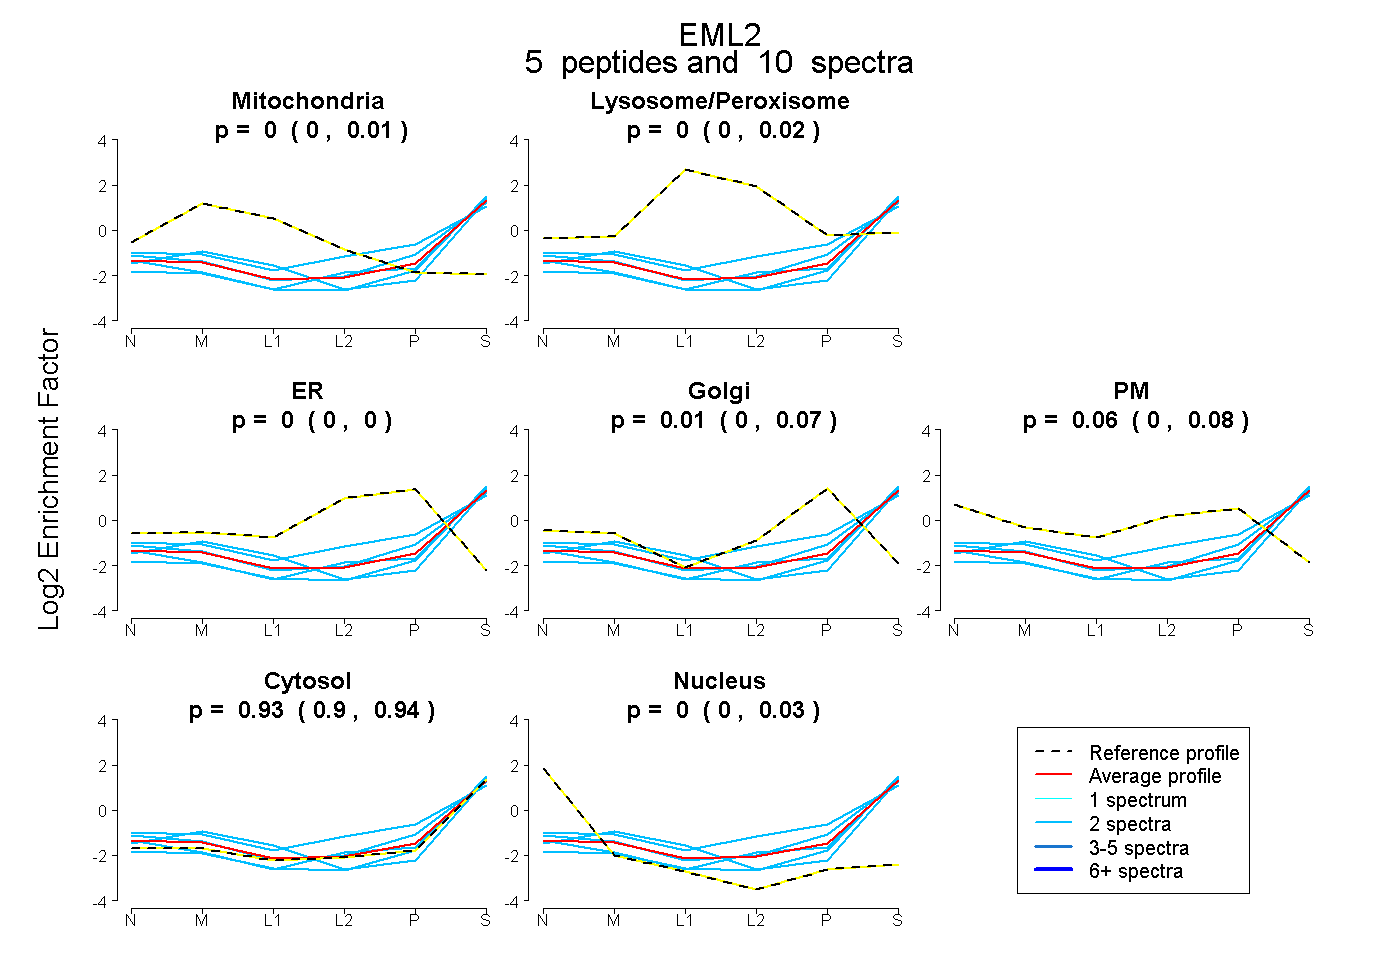
0.000 | 0.012
0.000 | 0.019
0.000 | 0.000
0.000 | 0.069
0.000 | 0.077
0.900 | 0.937
0.000 | 0.027
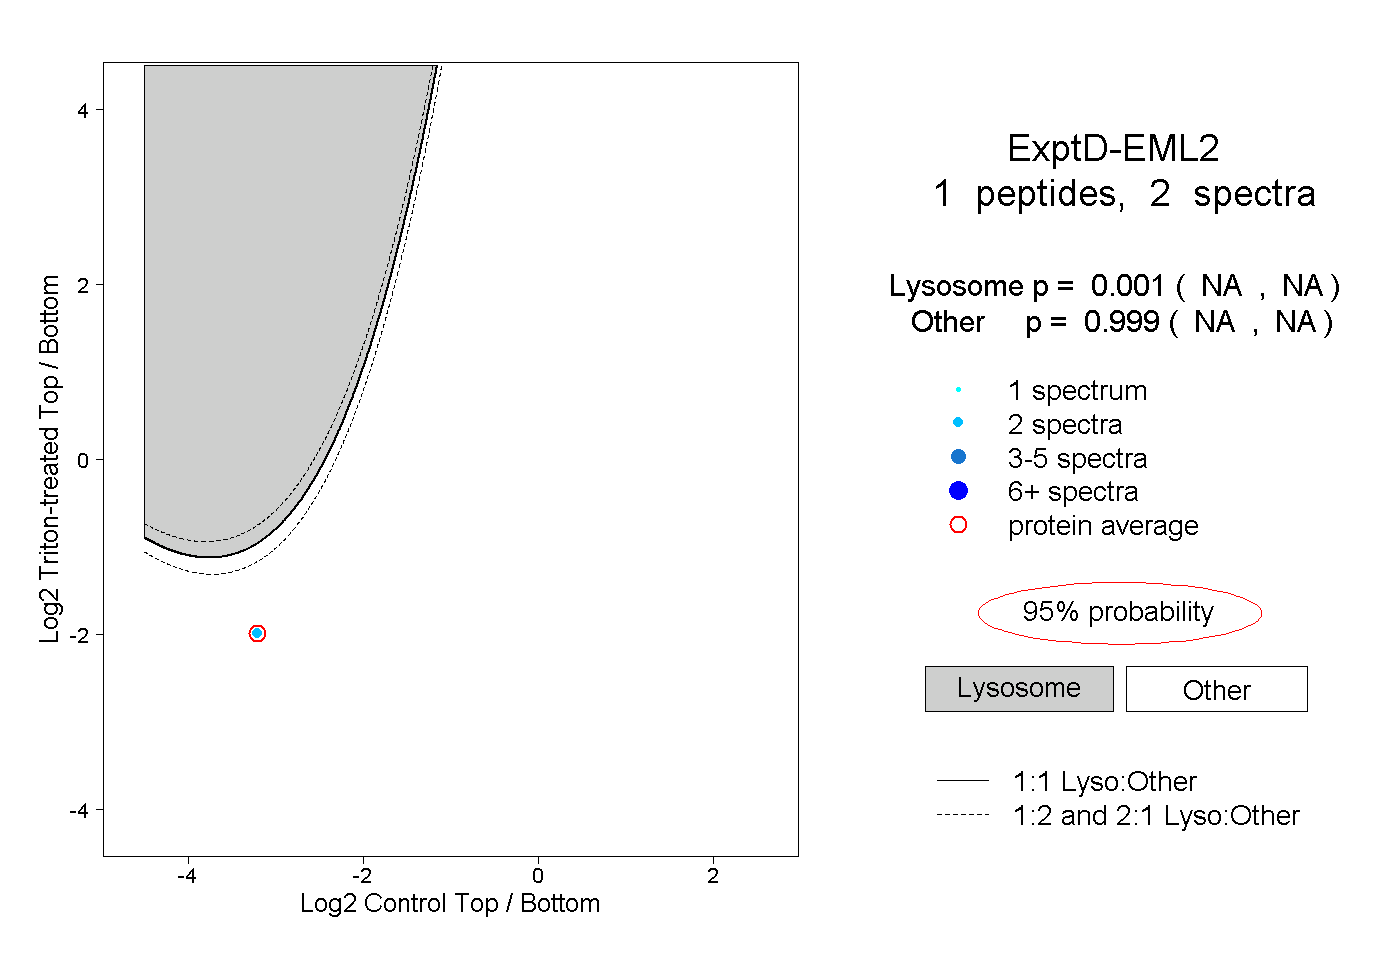
10peptides
spectra
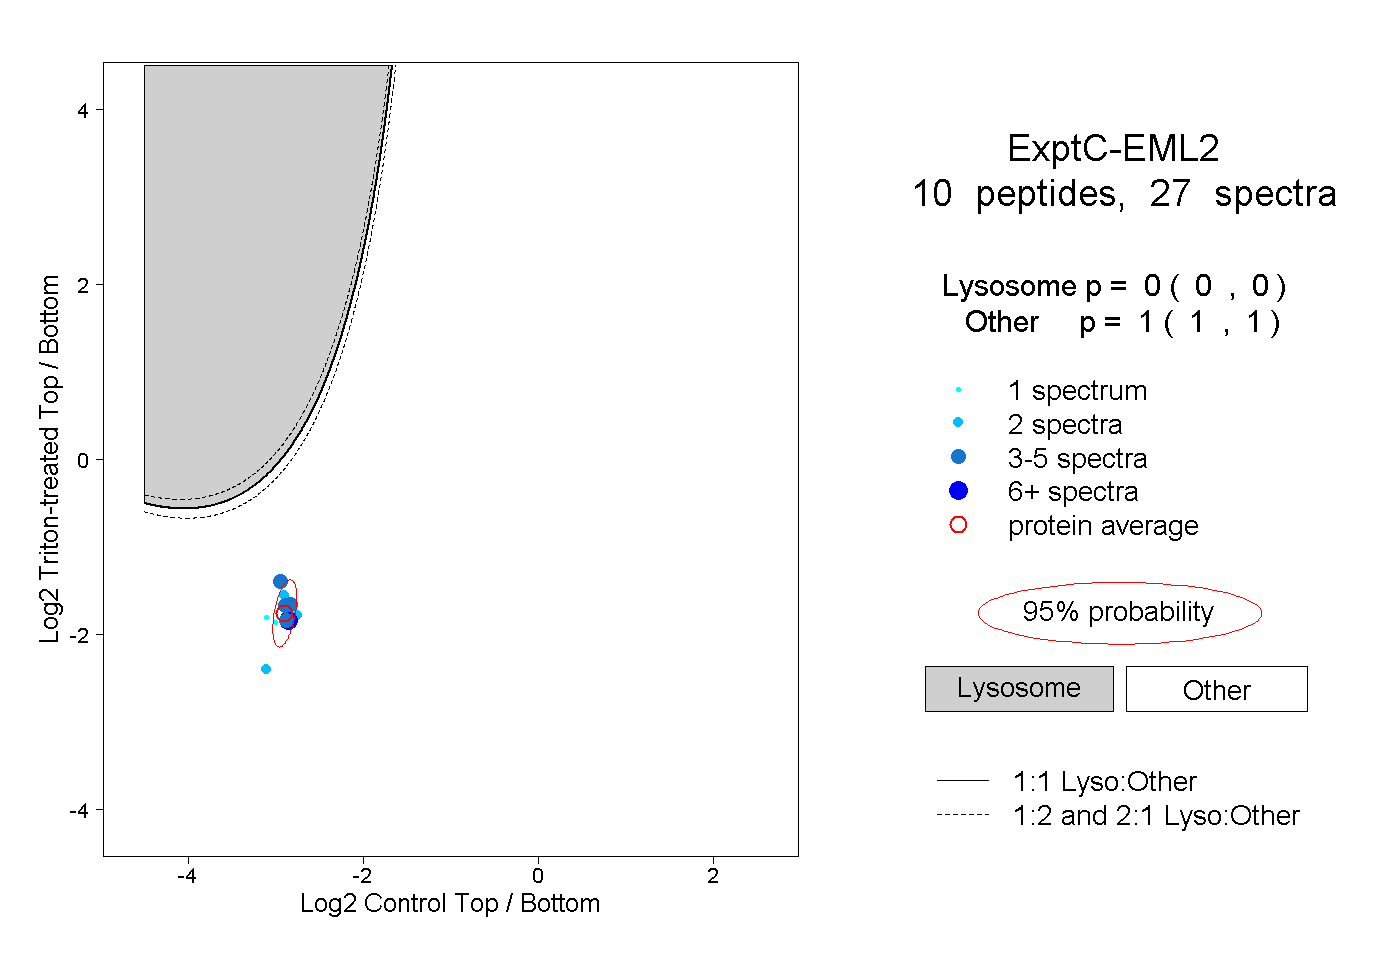
0.000 | 0.000
1.000 | 1.000