 13
13peptides
spectra
0.000 | 0.000
0.000 | 0.000
0.000 | 0.000
0.000 | 0.000
0.000 | 0.000
0.000 | 0.000
0.937 | 0.957
0.040 | 0.060
| Plot | Mito | Lyso | Perox | ER | Golgi | PM | Cytosol | Nucleus | |||||
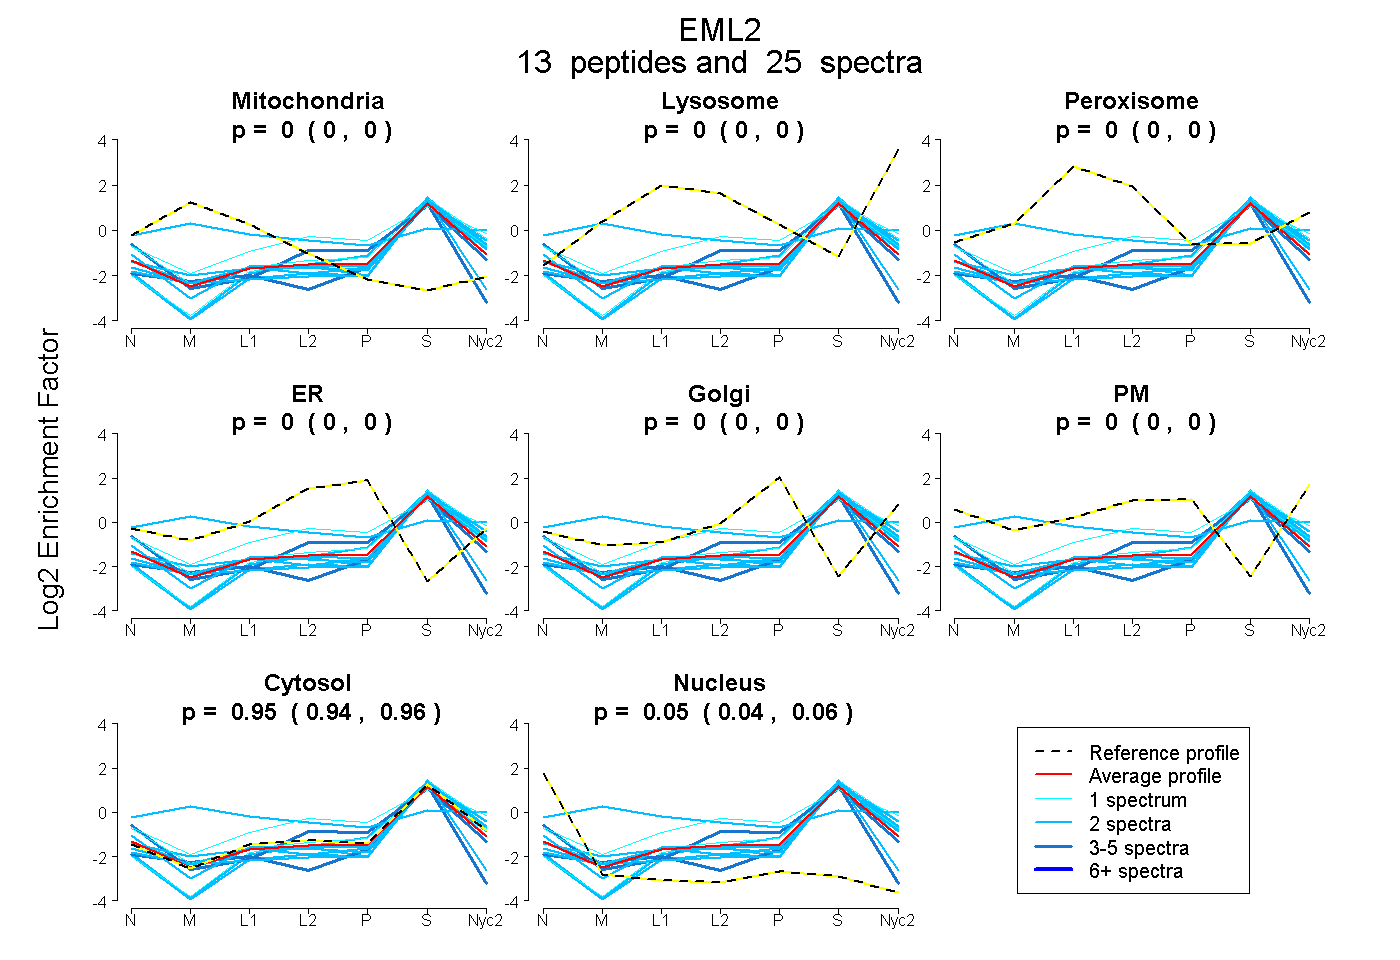
| Expt A |
13 peptides |
25 spectra |
|
0.000 0.000 | 0.000 |
0.000 0.000 | 0.000 |
0.000 0.000 | 0.000 |
0.000 0.000 | 0.000 |
0.000 0.000 | 0.000 |
0.000 0.000 | 0.000 |
0.948 0.937 | 0.957 |
0.052 0.040 | 0.060 |
| 2 spectra, VHLFSYPCCQPR | 0.000 | 0.000 | 0.000 | 0.000 | 0.000 | 0.000 | 0.866 | 0.134 | ||
| 1 spectrum, SELPSSR | 0.000 | 0.000 | 0.000 | 0.000 | 0.000 | 0.055 | 0.893 | 0.052 | ||
| 3 spectra, GRPVPMLIPDELAPTYSLDTR | 0.000 | 0.000 | 0.000 | 0.058 | 0.000 | 0.000 | 0.849 | 0.093 | ||
| 3 spectra, ITQEVLGAHDGGVFALCALR | 0.000 | 0.000 | 0.000 | 0.000 | 0.000 | 0.000 | 0.788 | 0.212 | ||
| 1 spectrum, SIEDPAR | 0.000 | 0.000 | 0.085 | 0.001 | 0.000 | 0.182 | 0.732 | 0.000 | ||
| 2 spectra, TVAEGR | 0.000 | 0.000 | 0.000 | 0.000 | 0.000 | 0.000 | 0.978 | 0.022 | ||
| 2 spectra, SAGFHPSGSVLAVGTVTGR | 0.248 | 0.097 | 0.130 | 0.000 | 0.000 | 0.145 | 0.380 | 0.000 | ||
| 2 spectra, GDTLYVGTTR | 0.000 | 0.000 | 0.000 | 0.000 | 0.000 | 0.000 | 0.981 | 0.019 | ||
| 2 spectra, DGTLVSGGGR | 0.000 | 0.000 | 0.000 | 0.000 | 0.000 | 0.000 | 0.959 | 0.041 | ||
| 2 spectra, DTSVLQWR | 0.000 | 0.000 | 0.000 | 0.000 | 0.000 | 0.000 | 1.000 | 0.000 | ||
| 2 spectra, QITSADTVR | 0.042 | 0.000 | 0.000 | 0.000 | 0.000 | 0.000 | 0.955 | 0.003 | ||
| 2 spectra, WLLLDTDTR | 0.000 | 0.000 | 0.000 | 0.000 | 0.000 | 0.000 | 0.944 | 0.056 | ||
| 1 spectrum, HYLGHNDDIK | 0.000 | 0.000 | 0.000 | 0.000 | 0.000 | 0.000 | 1.000 | 0.000 |
| Plot | Mito | Lyso or Perox | ER | Golgi | PM | Cytosol | Nucleus | ||||||
| Expt B |
5 peptides |
10 spectra |
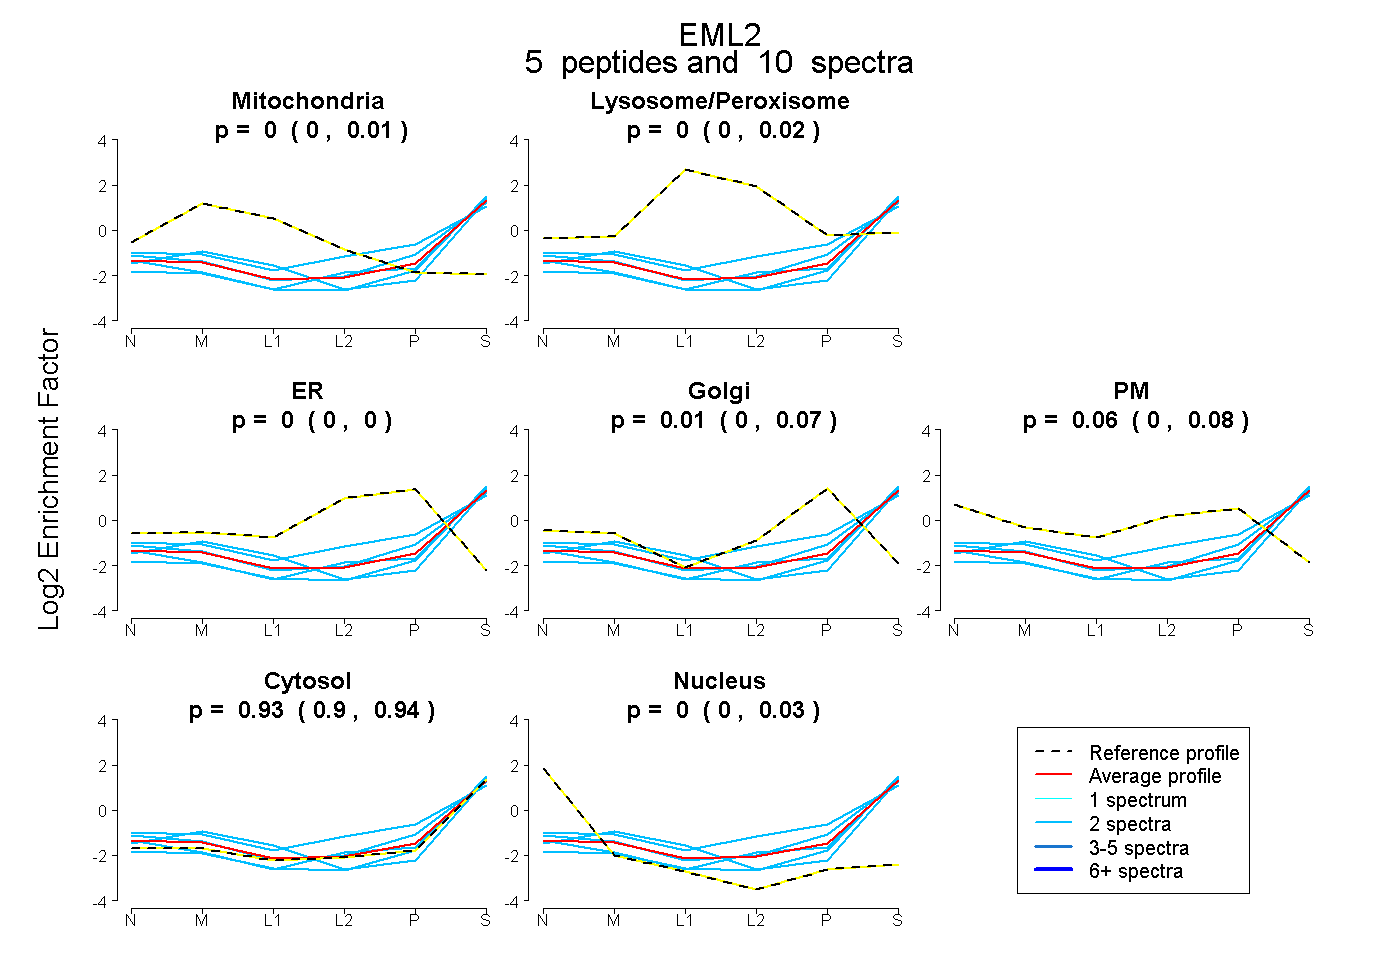 |
0.000 0.000 | 0.012 |
0.000 0.000 | 0.019 |
0.000 0.000 | 0.000 |
0.009 0.000 | 0.069 |
0.062 0.000 | 0.077 |
0.927 0.900 | 0.937 |
0.003 0.000 | 0.027 |
|||
| Plot | Lyso | Other | |||||||||||
| Expt C |
10 peptides |
27 spectra |
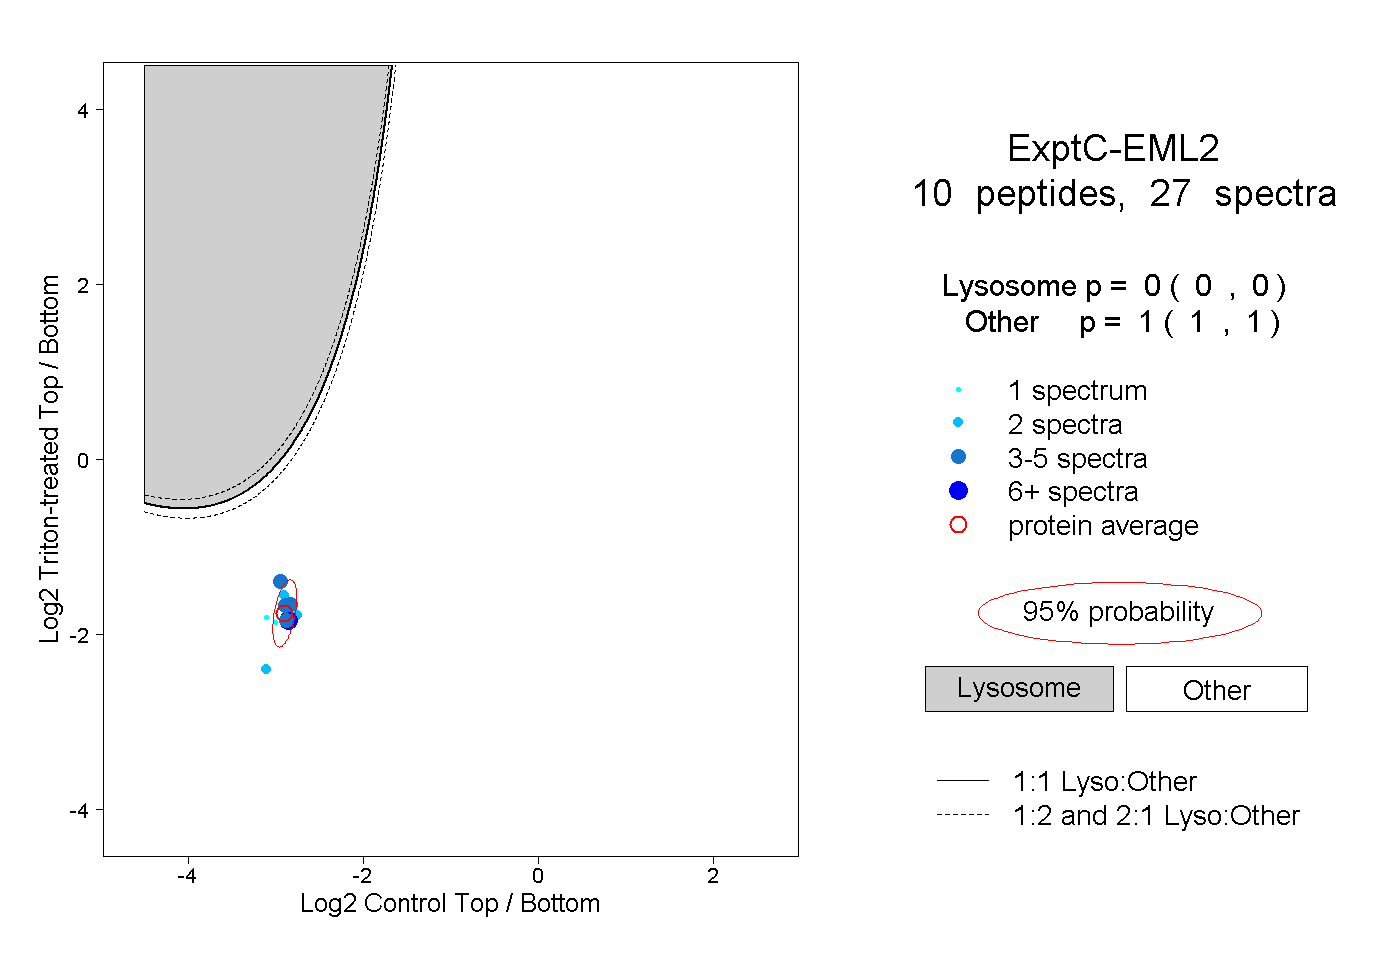 |
0.000 0.000 | 0.000 |
1.000 1.000 | 1.000 |
||||||||
| Plot | Lyso | Other | |||||||||||
| Expt D |
1 peptide |
2 spectra |
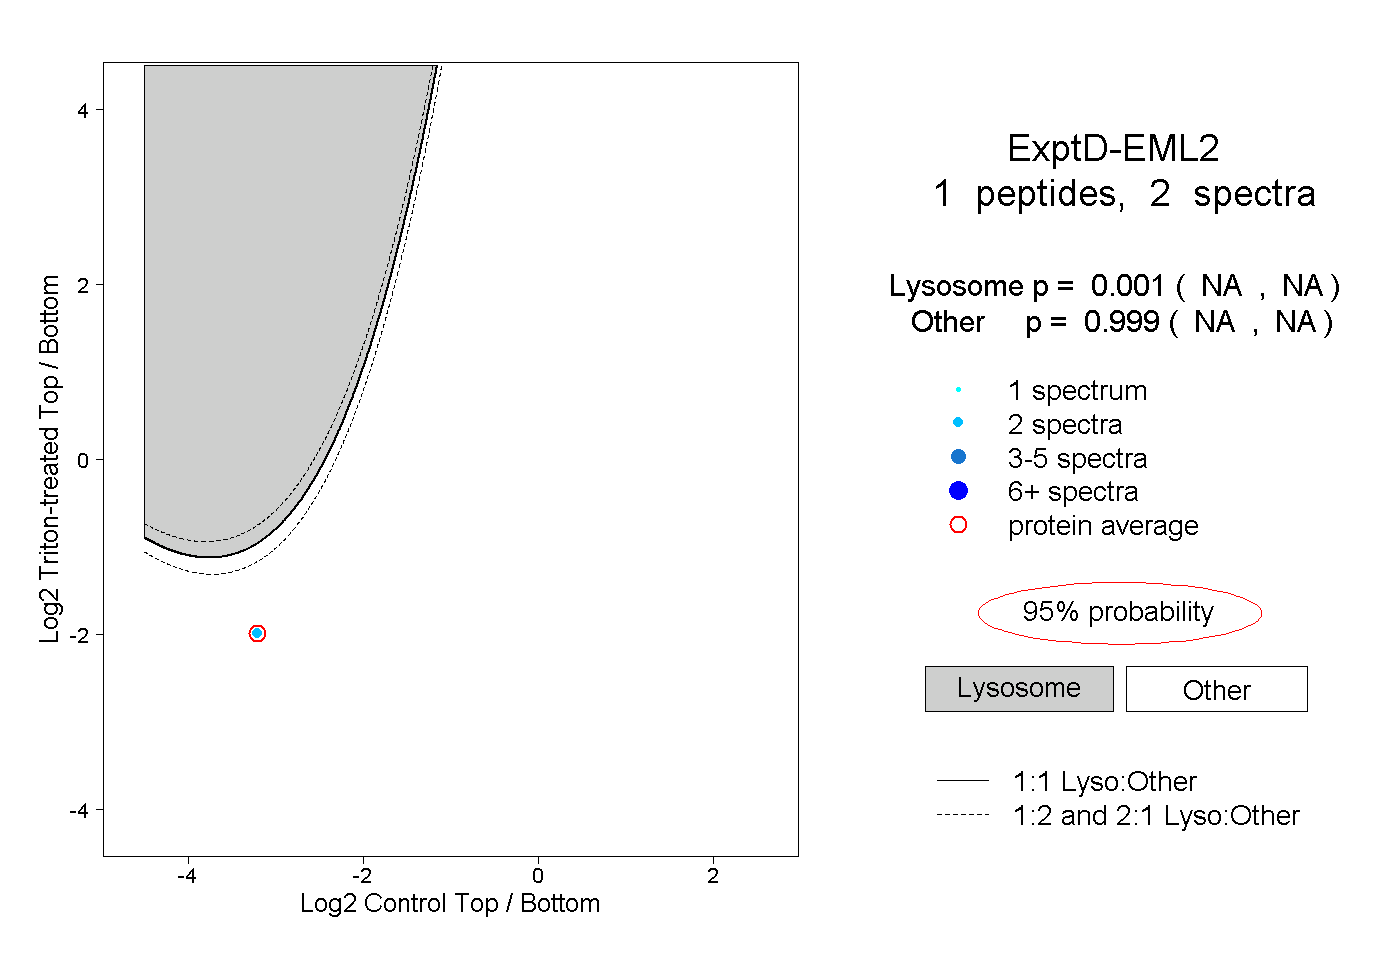 |
0.001 NA | NA |
0.999 NA | NA |