10
10peptides
spectra
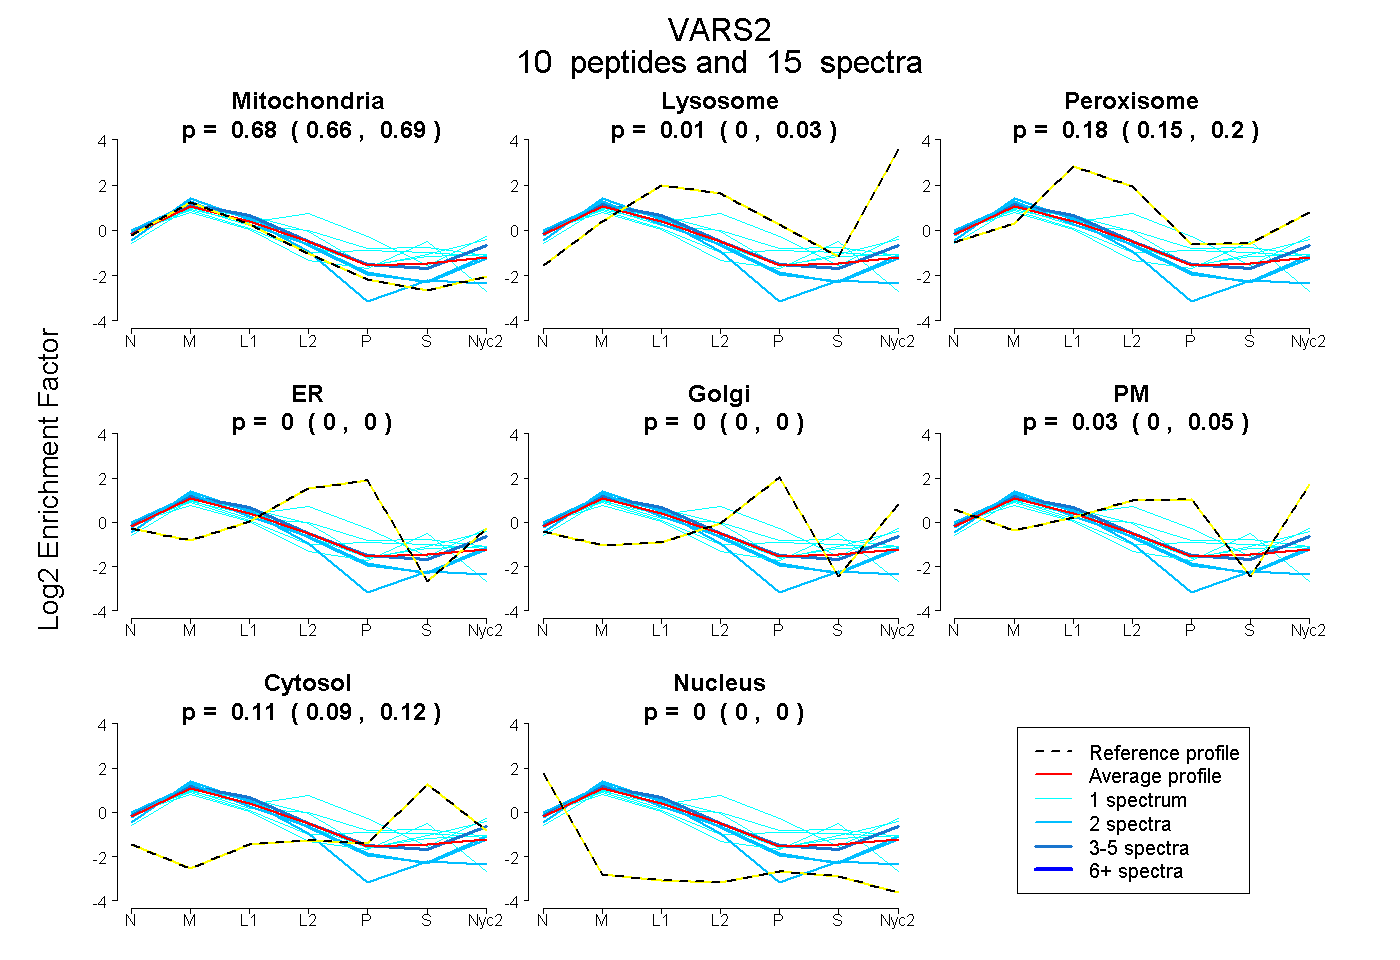
0.656 | 0.694
0.000 | 0.035
0.149 | 0.200
0.000 | 0.000
0.000 | 0.000
0.000 | 0.048
0.092 | 0.116
0.000 | 0.000
3peptides
spectra
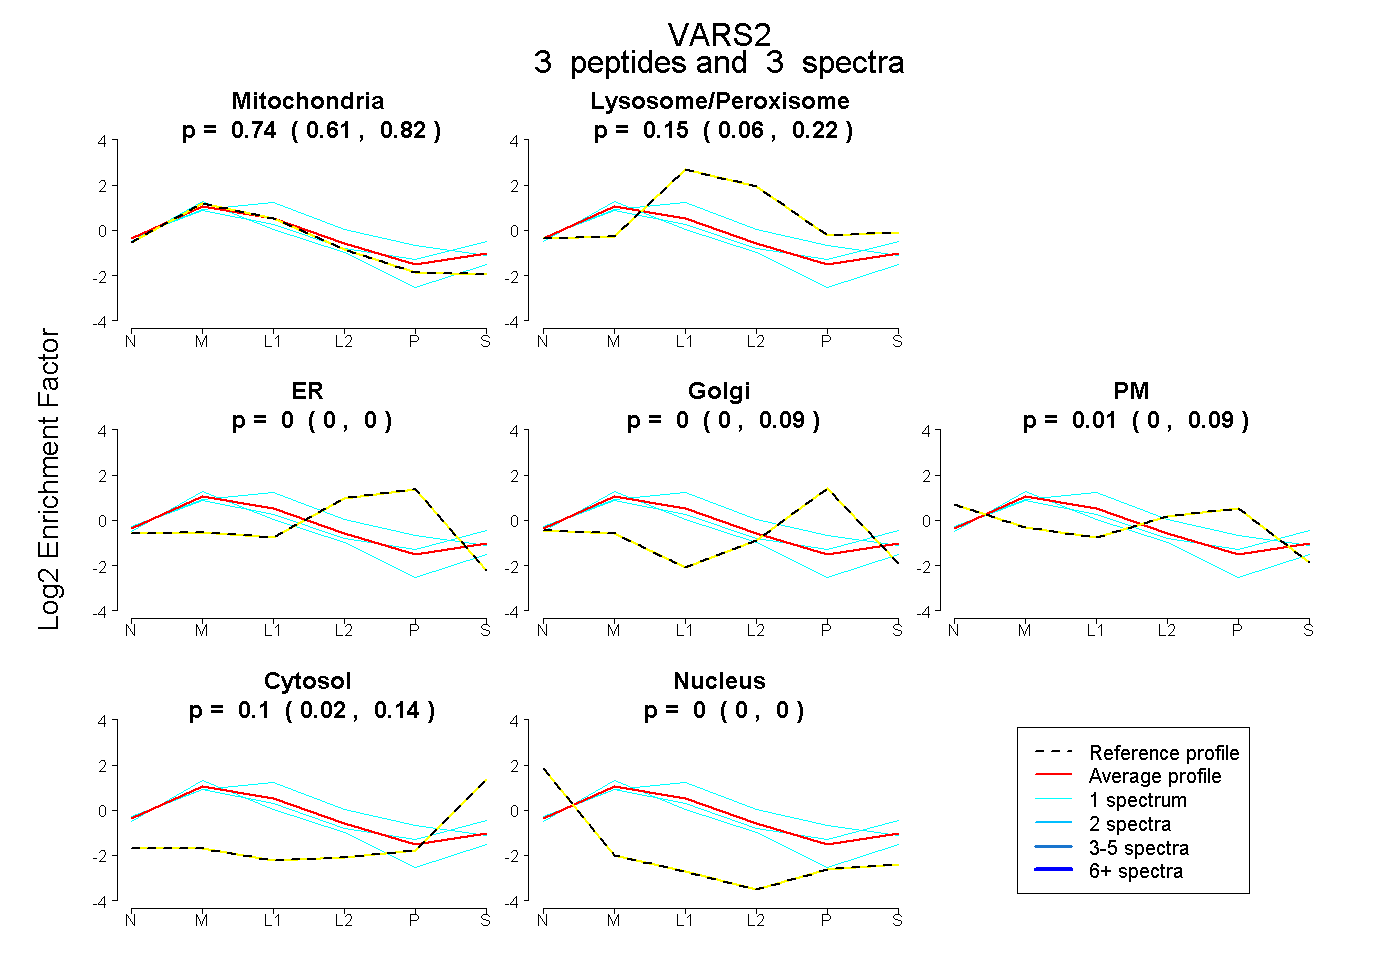
0.610 | 0.822
0.058 | 0.221
0.000 | 0.000
0.000 | 0.094
0.000 | 0.088
0.024 | 0.139
0.000 | 0.000
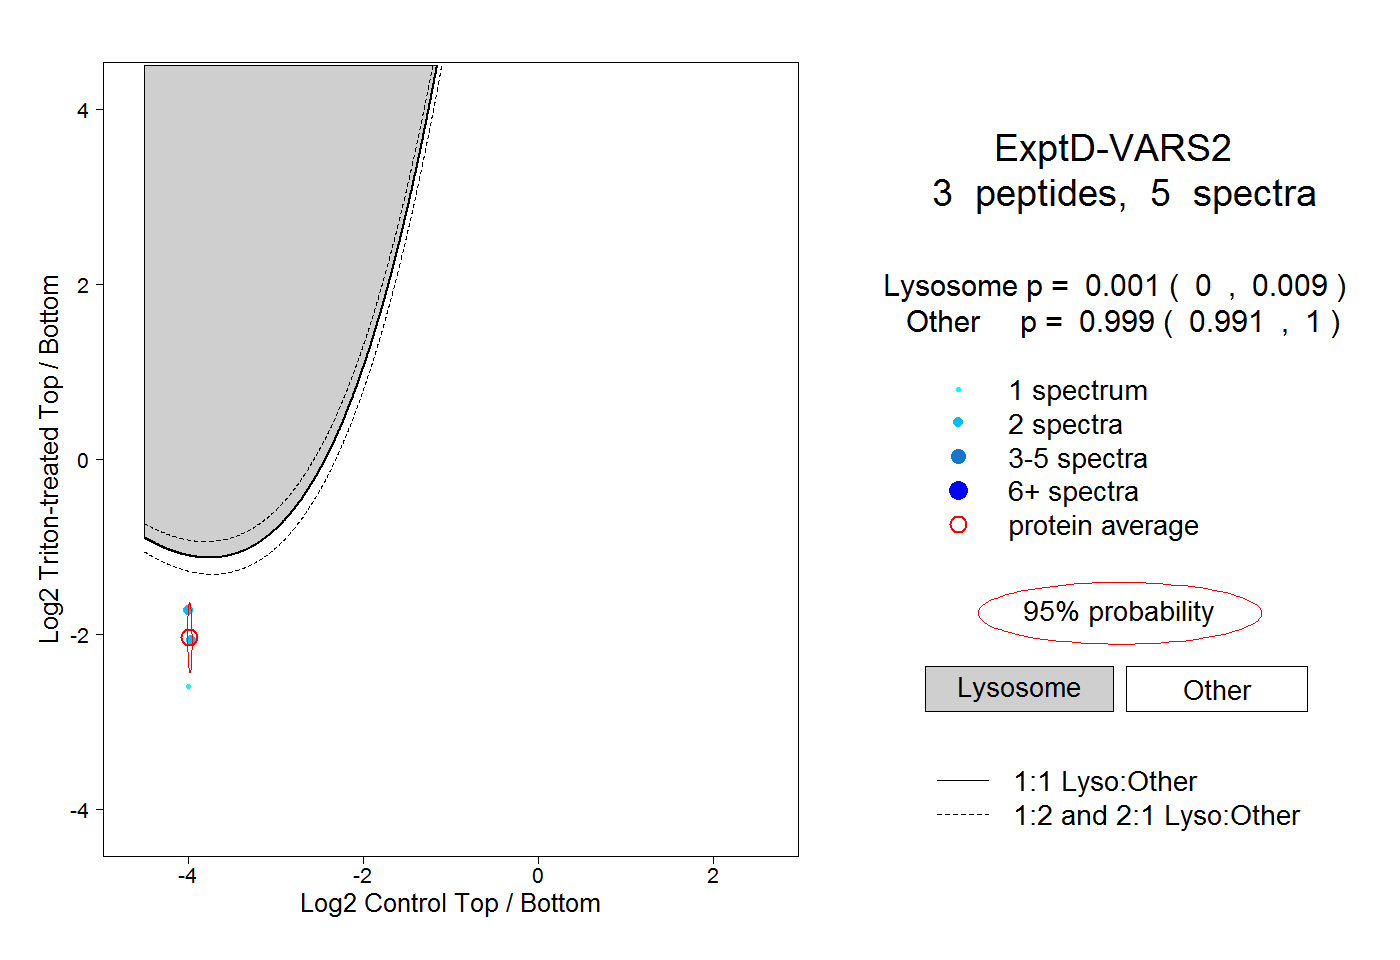
16peptides
spectra
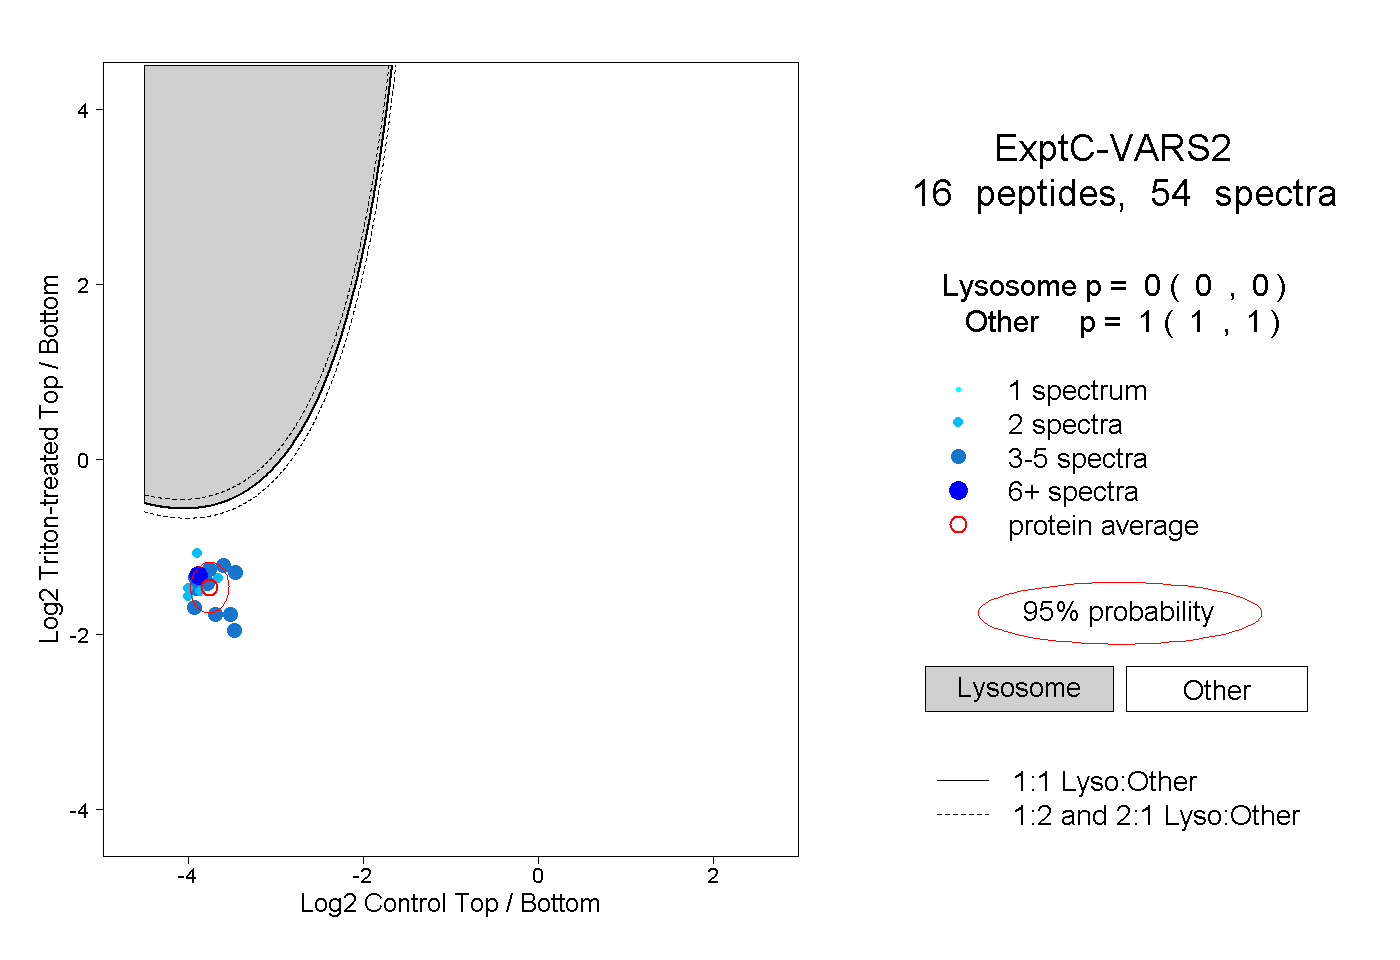
0.000 | 0.000
1.000 | 1.000