 2
2peptides
spectra
0.017 | 0.032
0.000 | 0.009
0.026 | 0.075
0.586 | 0.629
0.224 | 0.285
0.023 | 0.069
0.000 | 0.000
0.000 | 0.000
| Plot | Mito | Lyso | Perox | ER | Golgi | PM | Cytosol | Nucleus | |||||
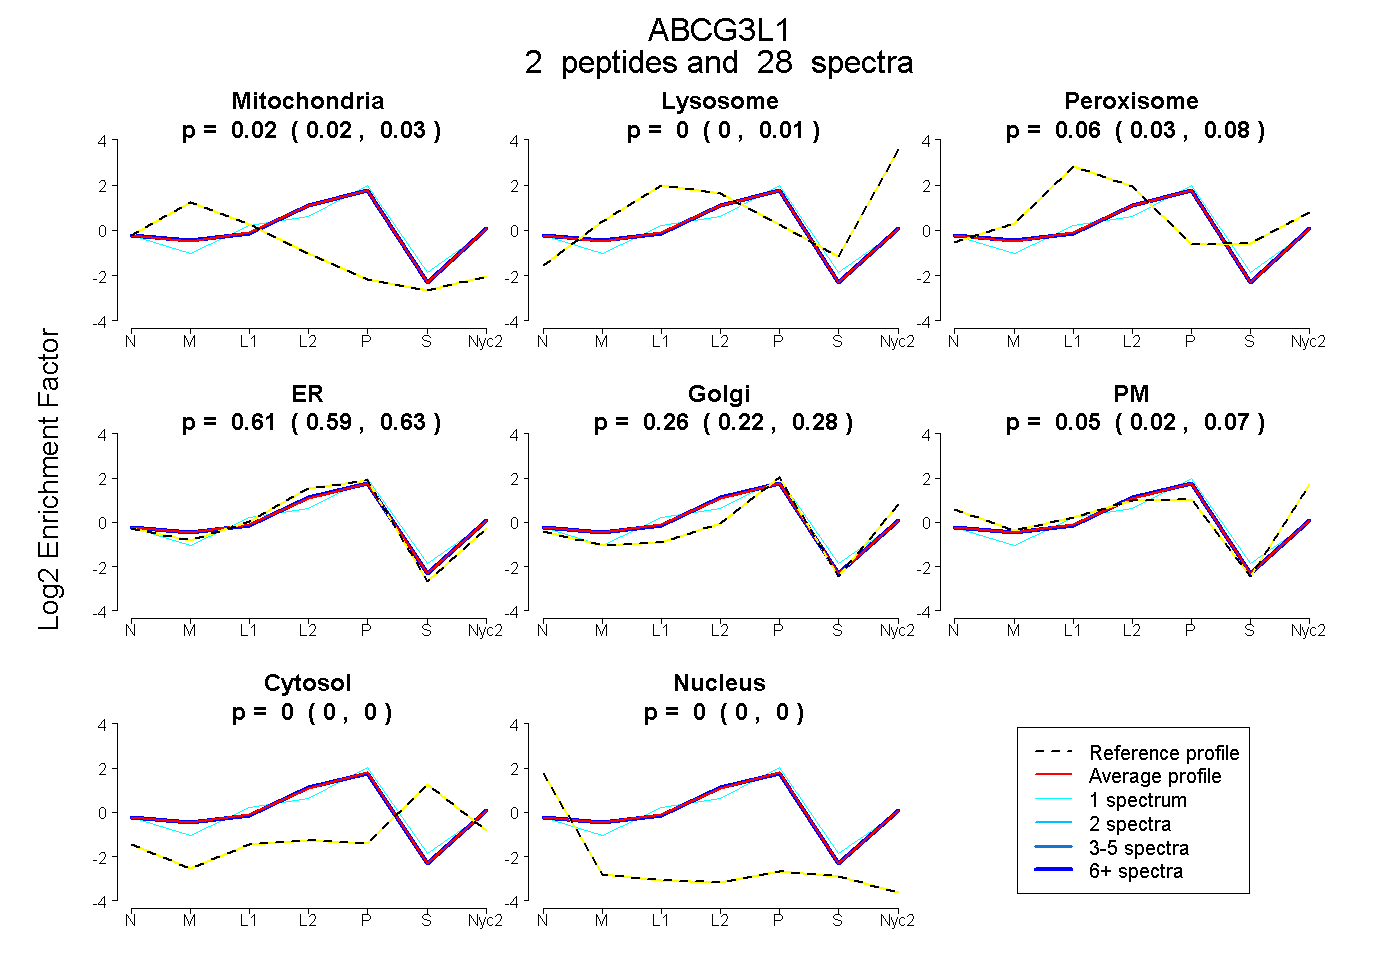
| Expt A |
2 peptides |
28 spectra |
|
0.024 0.017 | 0.032 |
0.000 0.000 | 0.009 |
0.058 0.026 | 0.075 |
0.607 0.586 | 0.629 |
0.261 0.224 | 0.285 |
0.050 0.023 | 0.069 |
0.000 0.000 | 0.000 |
0.000 0.000 | 0.000 |
| 1 spectrum, EAVLSFHNISYR | 0.000 | 0.000 | 0.086 | 0.505 | 0.354 | 0.000 | 0.056 | 0.000 | ||
| 27 spectra, LMFHGPAR | 0.027 | 0.002 | 0.049 | 0.616 | 0.244 | 0.061 | 0.000 | 0.000 |
| Plot | Lyso | Other | |||||||||||
| Expt C |
1 peptide |
2 spectra |
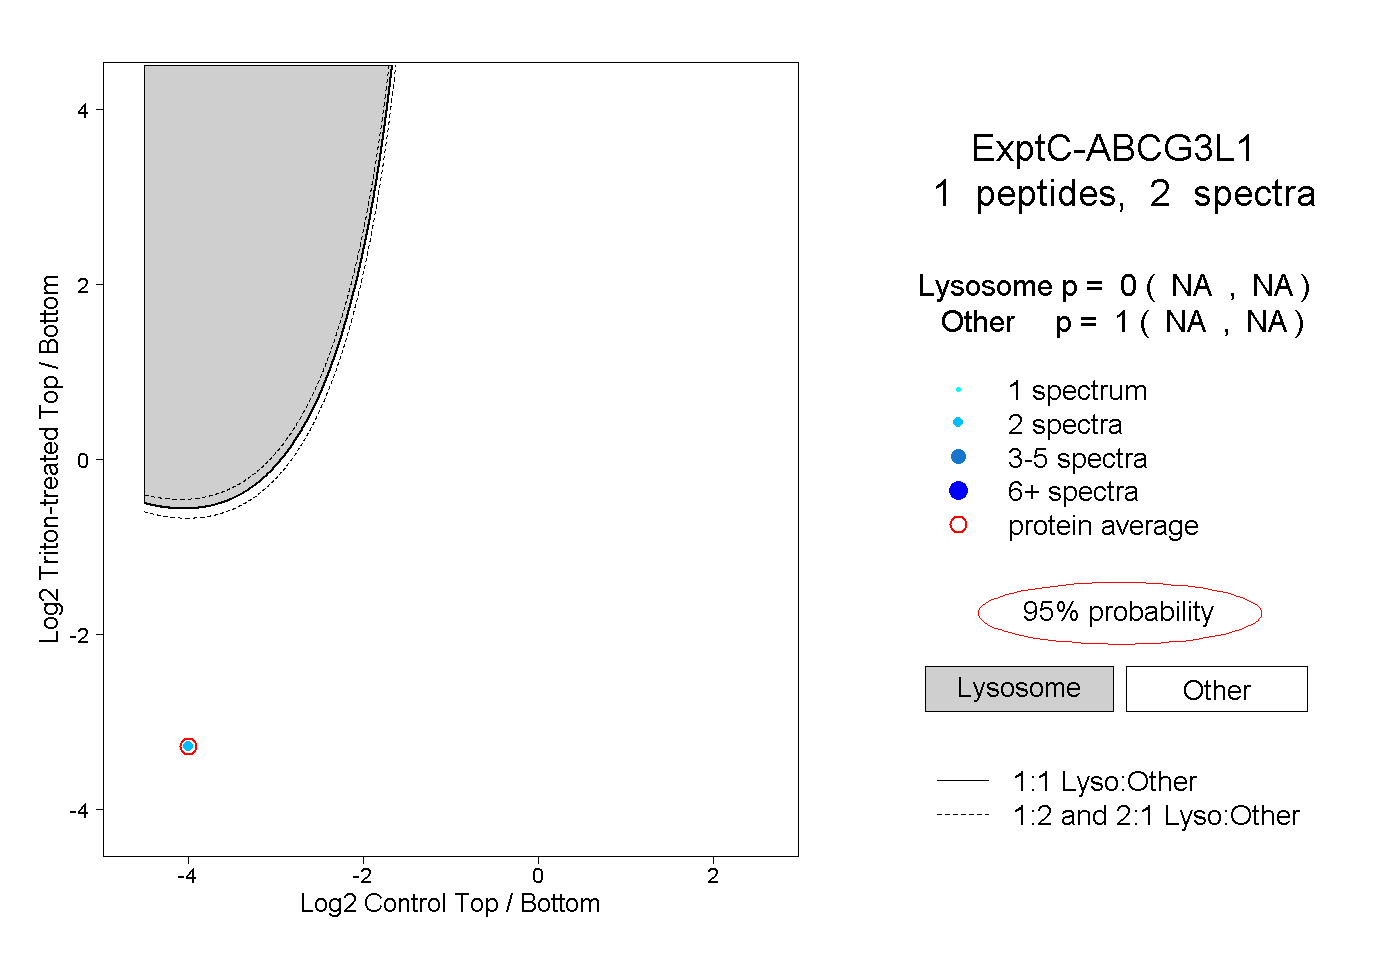 |
0.000 NA | NA |
1.000 NA | NA |