 10
10peptides
spectra
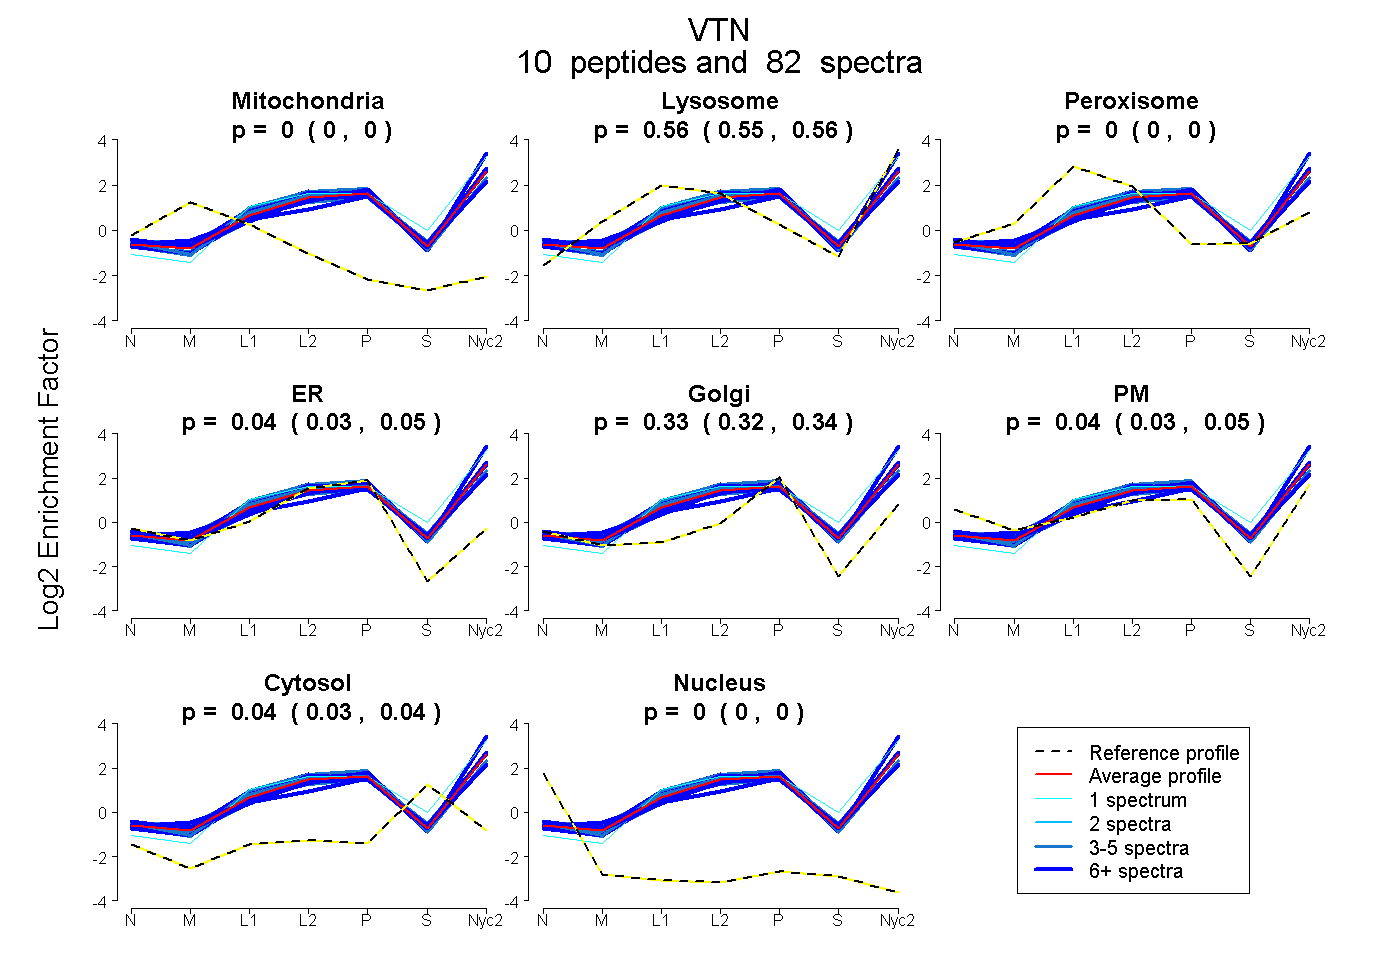
0.000 | 0.000
0.554 | 0.562
0.000 | 0.000
0.027 | 0.052
0.315 | 0.335
0.032 | 0.045
0.033 | 0.038
0.000 | 0.000
9peptides
spectra
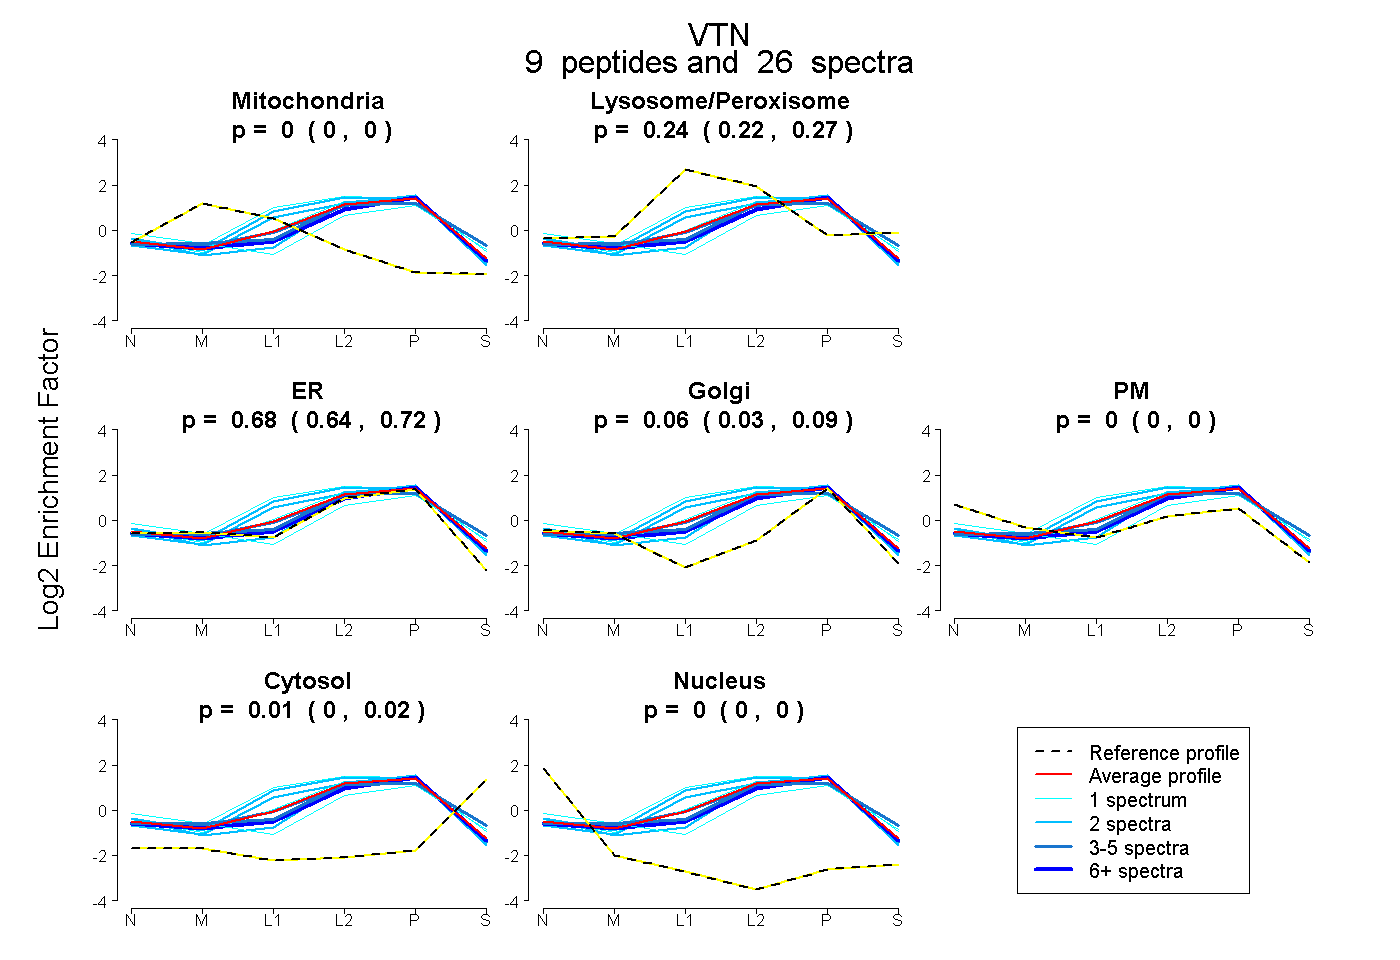
0.000 | 0.000
0.218 | 0.266
0.637 | 0.719
0.026 | 0.088
0.000 | 0.000
0.000 | 0.024
0.000 | 0.000
10peptides
spectra
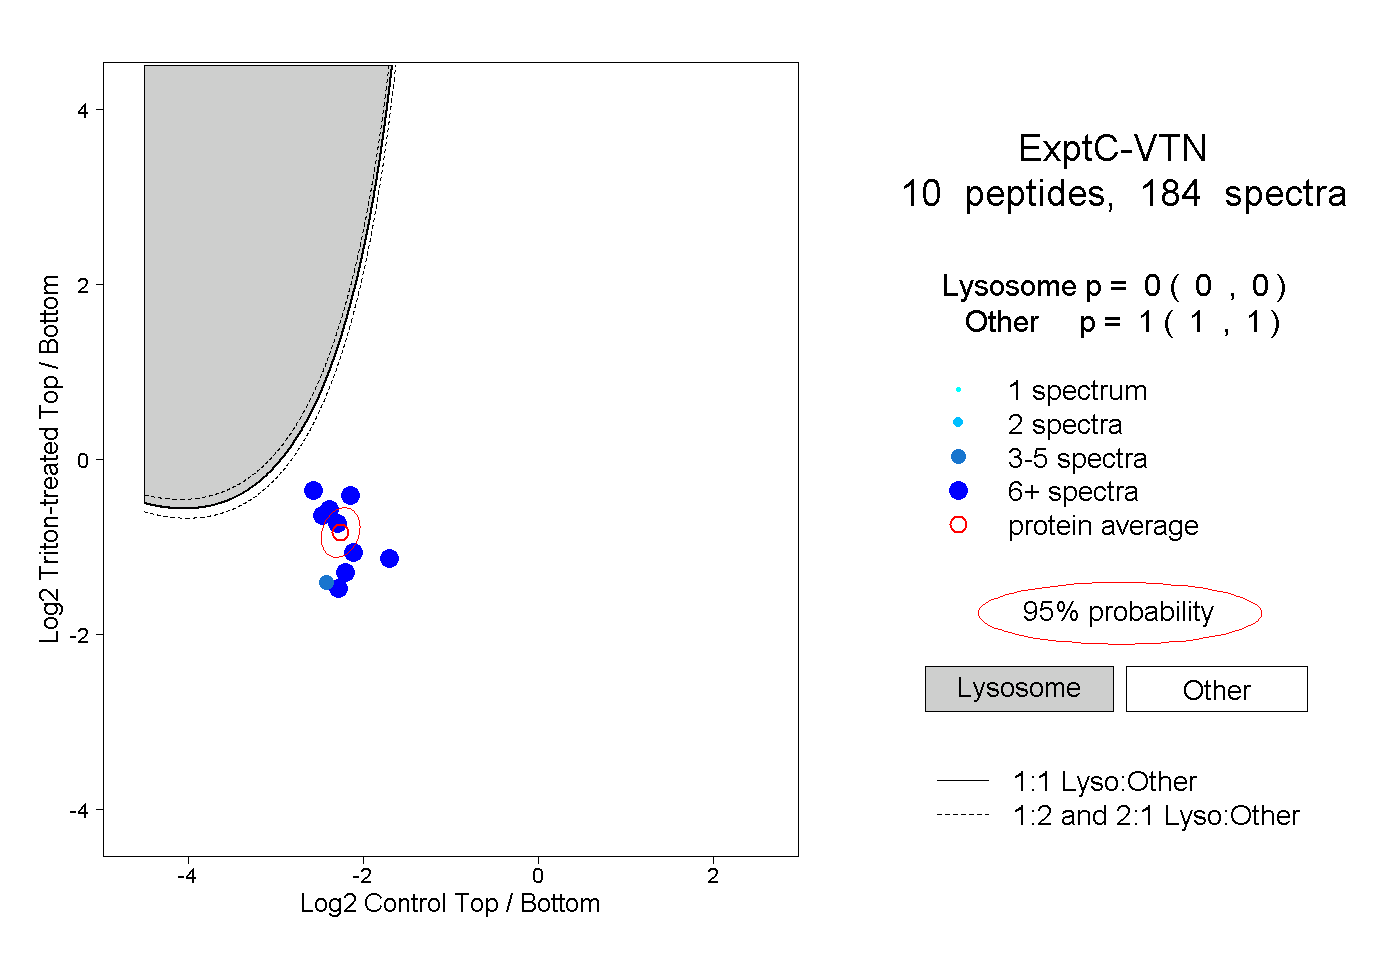
0.000 | 0.000
1.000 | 1.000
5peptides
spectra
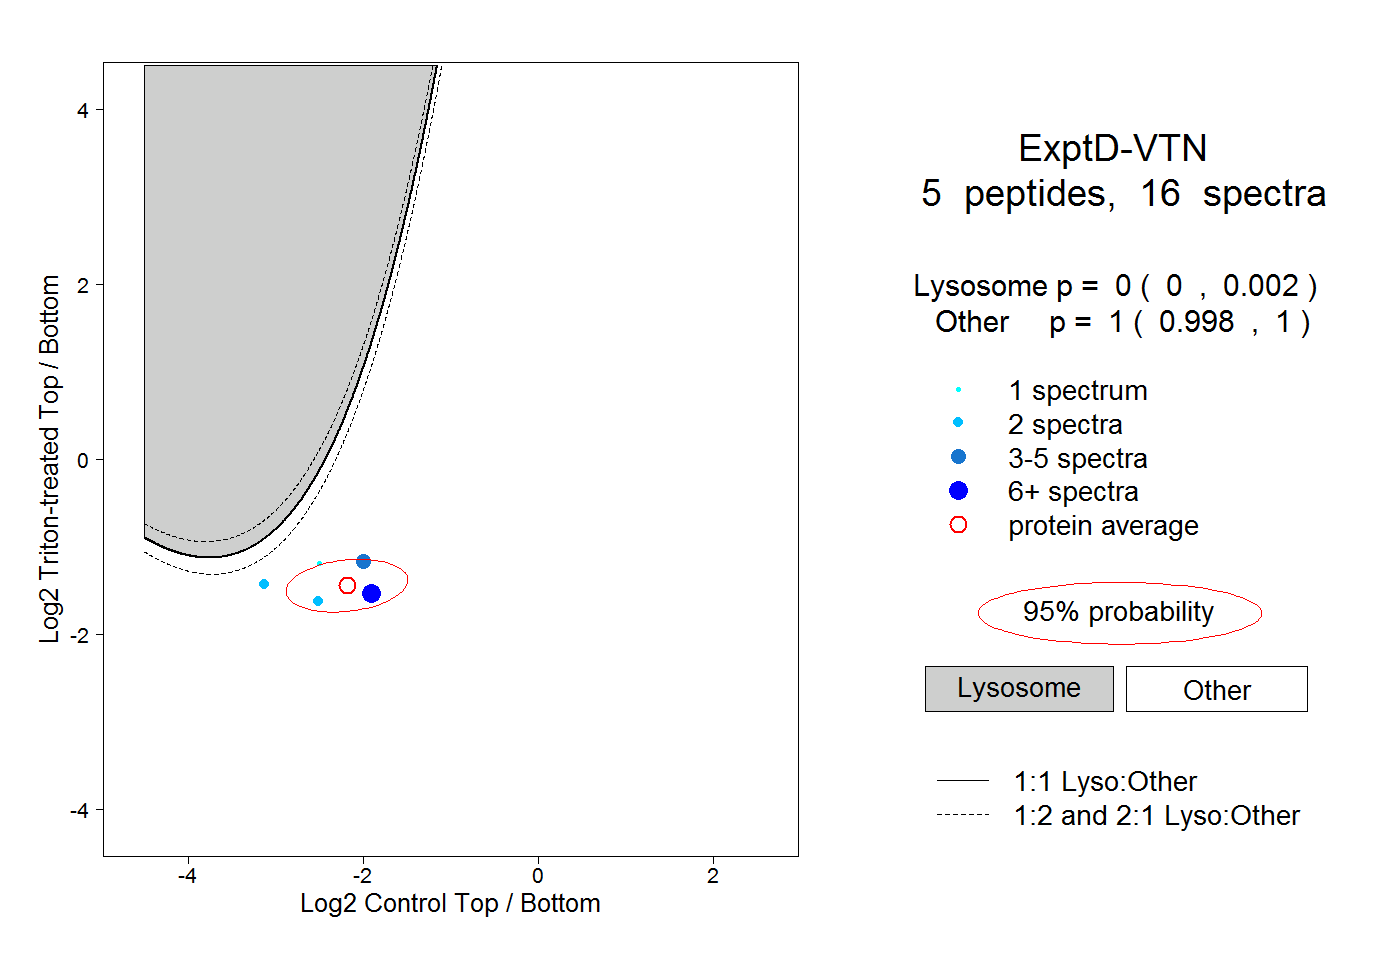
0.000 | 0.002
0.998 | 1.000