 7
7peptides
spectra
0.000 | 0.000
0.014 | 0.064
0.000 | 0.088
0.000 | 0.000
0.000 | 0.082
0.060 | 0.175
0.714 | 0.779
0.000 | 0.000
| Plot | Mito | Lyso | Perox | ER | Golgi | PM | Cytosol | Nucleus | |||||
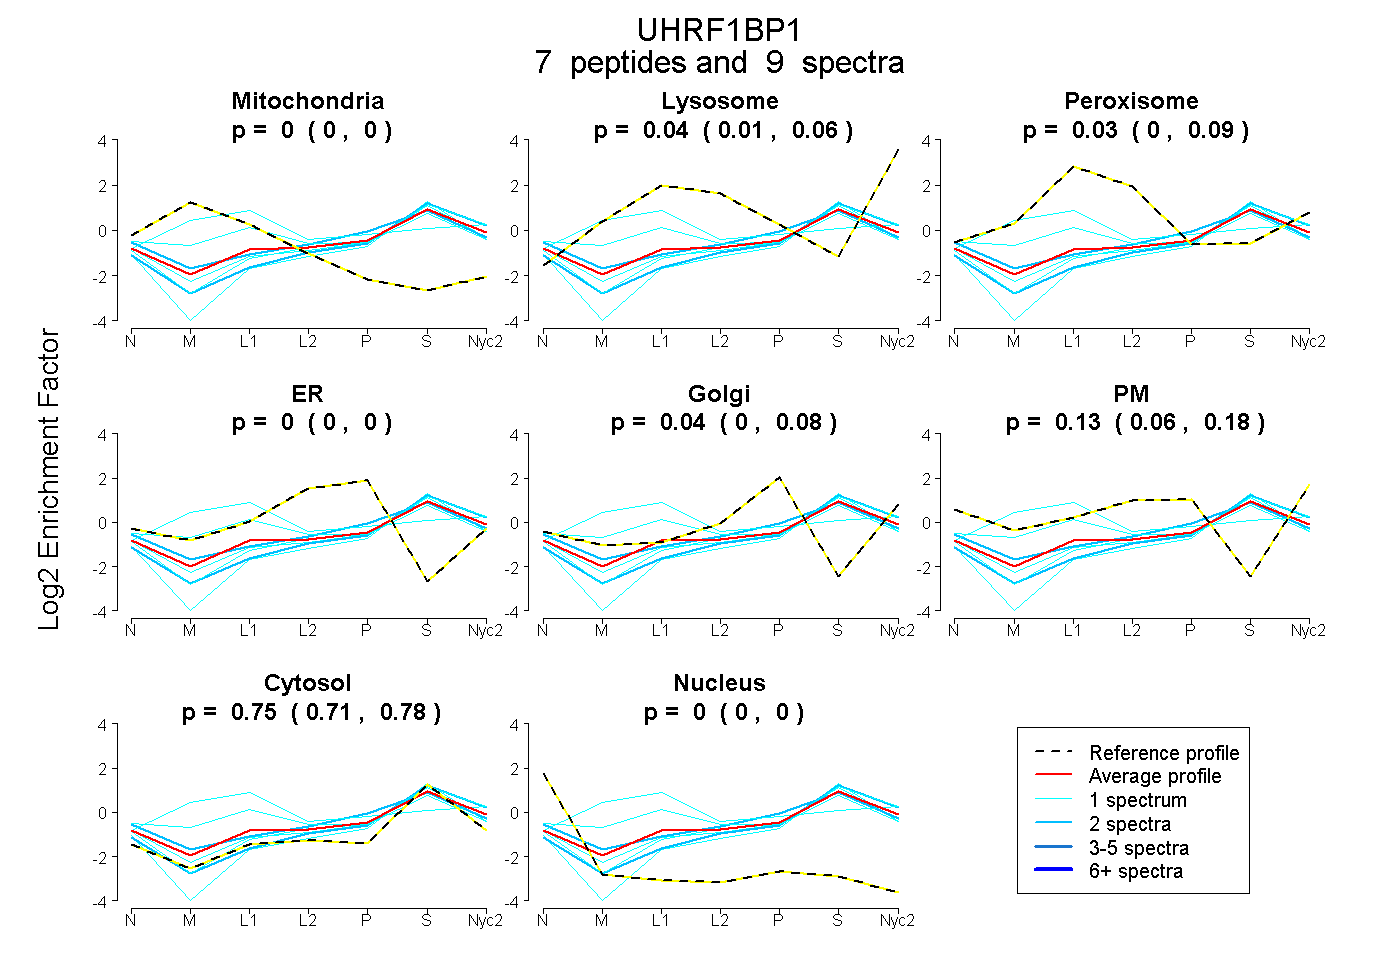
| Expt A |
7 peptides |
9 spectra |
|
0.000 0.000 | 0.000 |
0.043 0.014 | 0.064 |
0.034 0.000 | 0.088 |
0.000 0.000 | 0.000 |
0.041 0.000 | 0.082 |
0.130 0.060 | 0.175 |
0.752 0.714 | 0.779 |
0.000 0.000 | 0.000 |
| 1 spectrum, DSSAENLDASQER | 0.000 | 0.000 | 0.000 | 0.000 | 0.030 | 0.000 | 0.970 | 0.000 | ||
| 1 spectrum, KPSTLLSCSR | 0.000 | 0.000 | 0.000 | 0.000 | 0.033 | 0.138 | 0.829 | 0.000 | ||
| 2 spectra, LDHYQYLALLR | 0.000 | 0.000 | 0.037 | 0.001 | 0.145 | 0.123 | 0.693 | 0.000 | ||
| 1 spectrum, YAESLSEAMEK | 0.201 | 0.204 | 0.260 | 0.000 | 0.044 | 0.000 | 0.290 | 0.000 | ||
| 1 spectrum, SLSGSGEVLGAVR | 0.080 | 0.000 | 0.320 | 0.000 | 0.059 | 0.000 | 0.540 | 0.000 | ||
| 2 spectra, LITNQGR | 0.000 | 0.031 | 0.000 | 0.000 | 0.118 | 0.000 | 0.850 | 0.000 | ||
| 1 spectrum, QAAFGSPAWSR | 0.000 | 0.054 | 0.000 | 0.000 | 0.050 | 0.076 | 0.819 | 0.000 |
| Plot | Lyso | Other | |||||||||||
| Expt C |
4 peptides |
62 spectra |
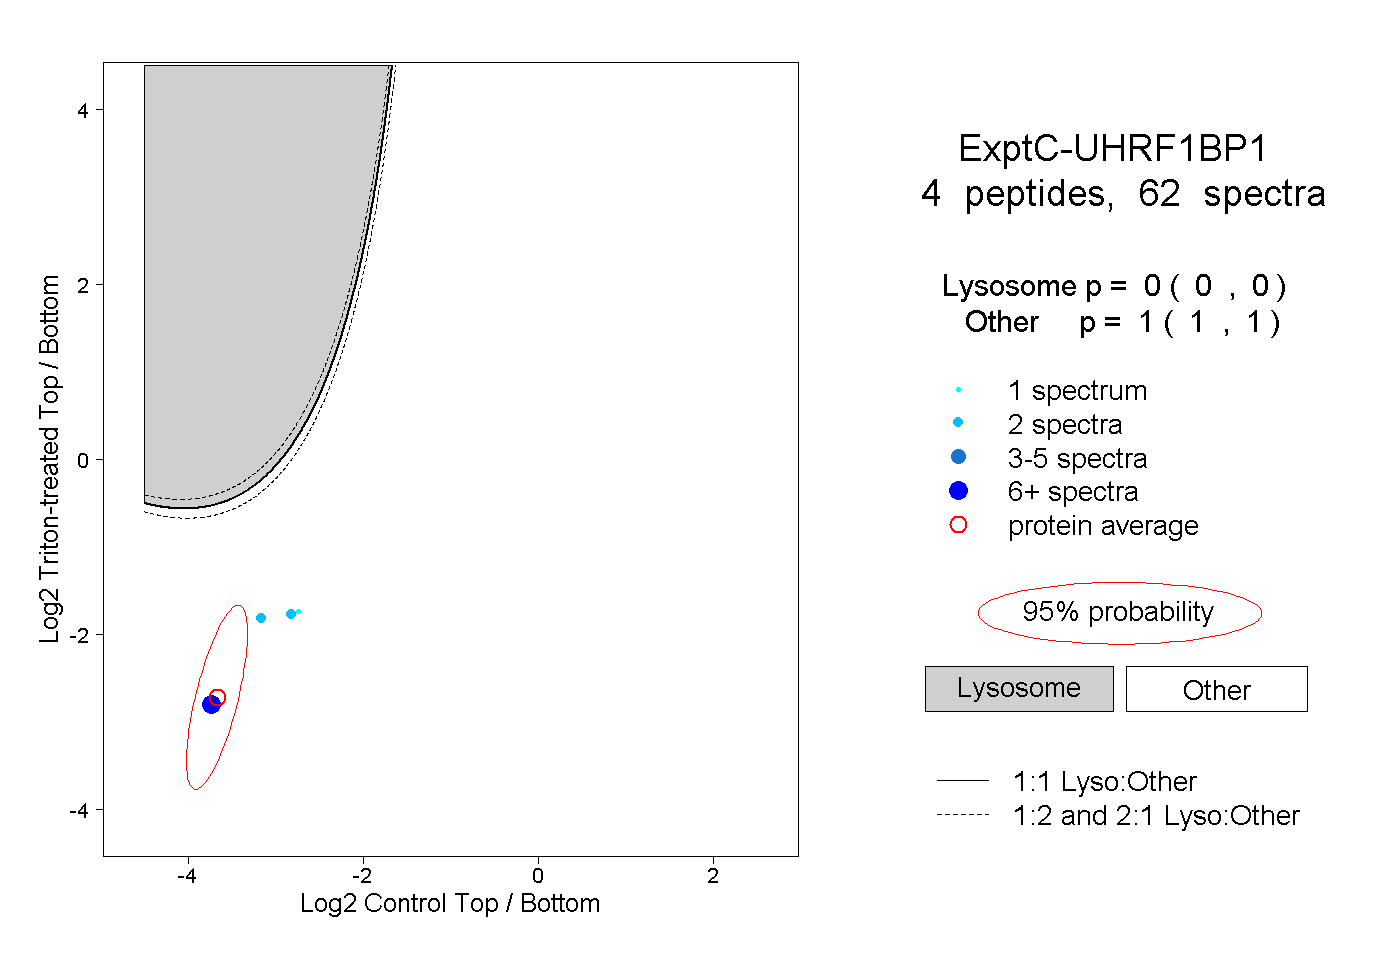 |
0.000 0.000 | 0.000 |
1.000 1.000 | 1.000 |
||||||||
| Plot | Lyso | Other | |||||||||||
| Expt D |
2 peptides |
3 spectra |
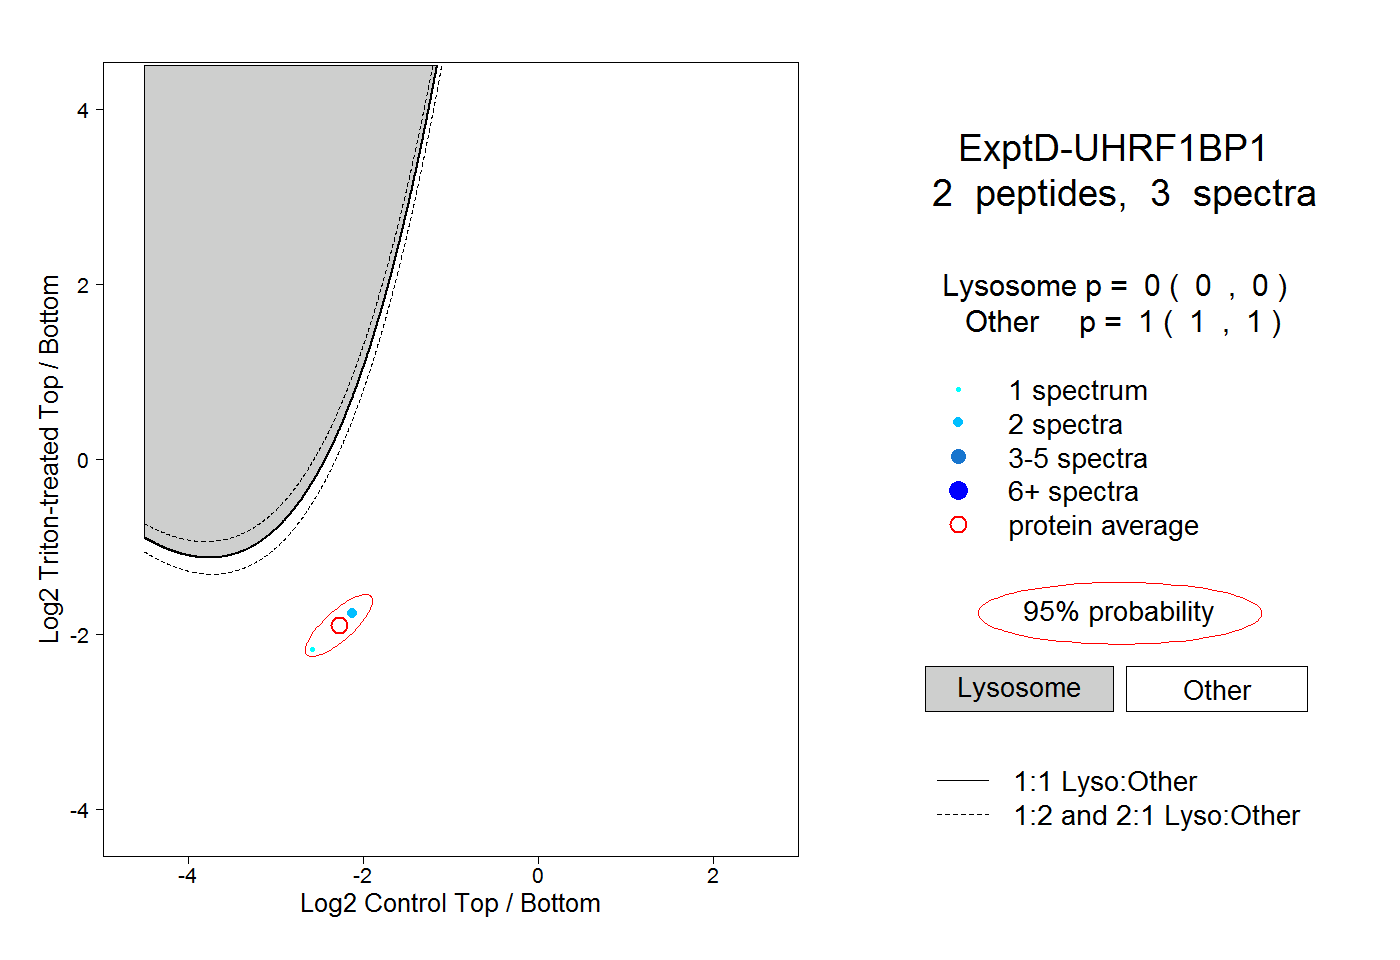 |
0.000 0.000 | 0.000 |
1.000 1.000 | 1.000 |