 8
8peptides
spectra
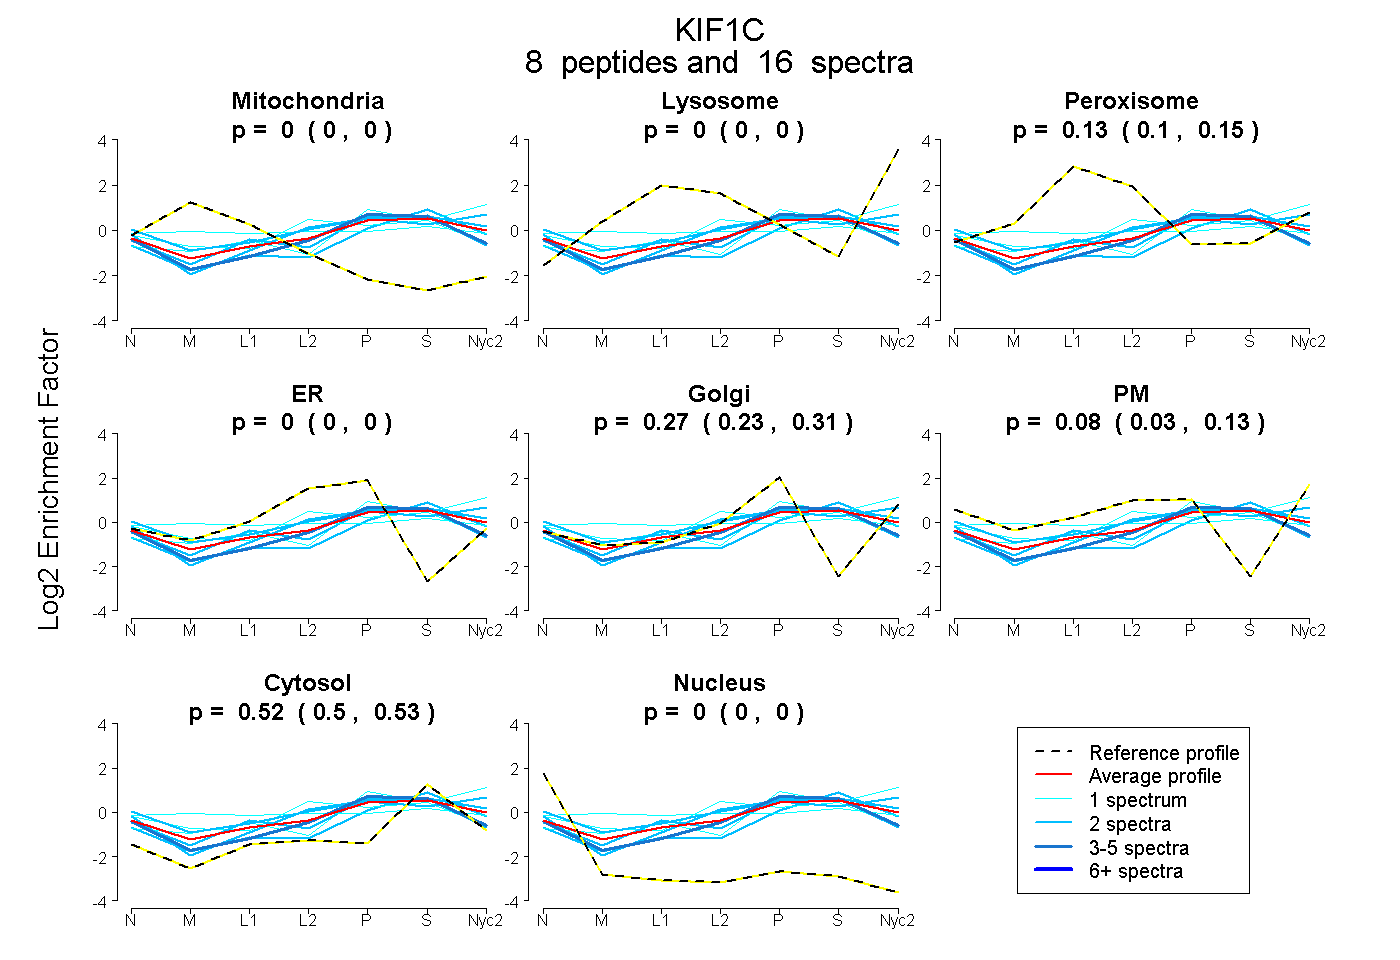
0.000 | 0.000
0.000 | 0.000
0.104 | 0.148
0.000 | 0.000
0.231 | 0.309
0.029 | 0.126
0.502 | 0.531
0.000 | 0.000
2peptides
spectra
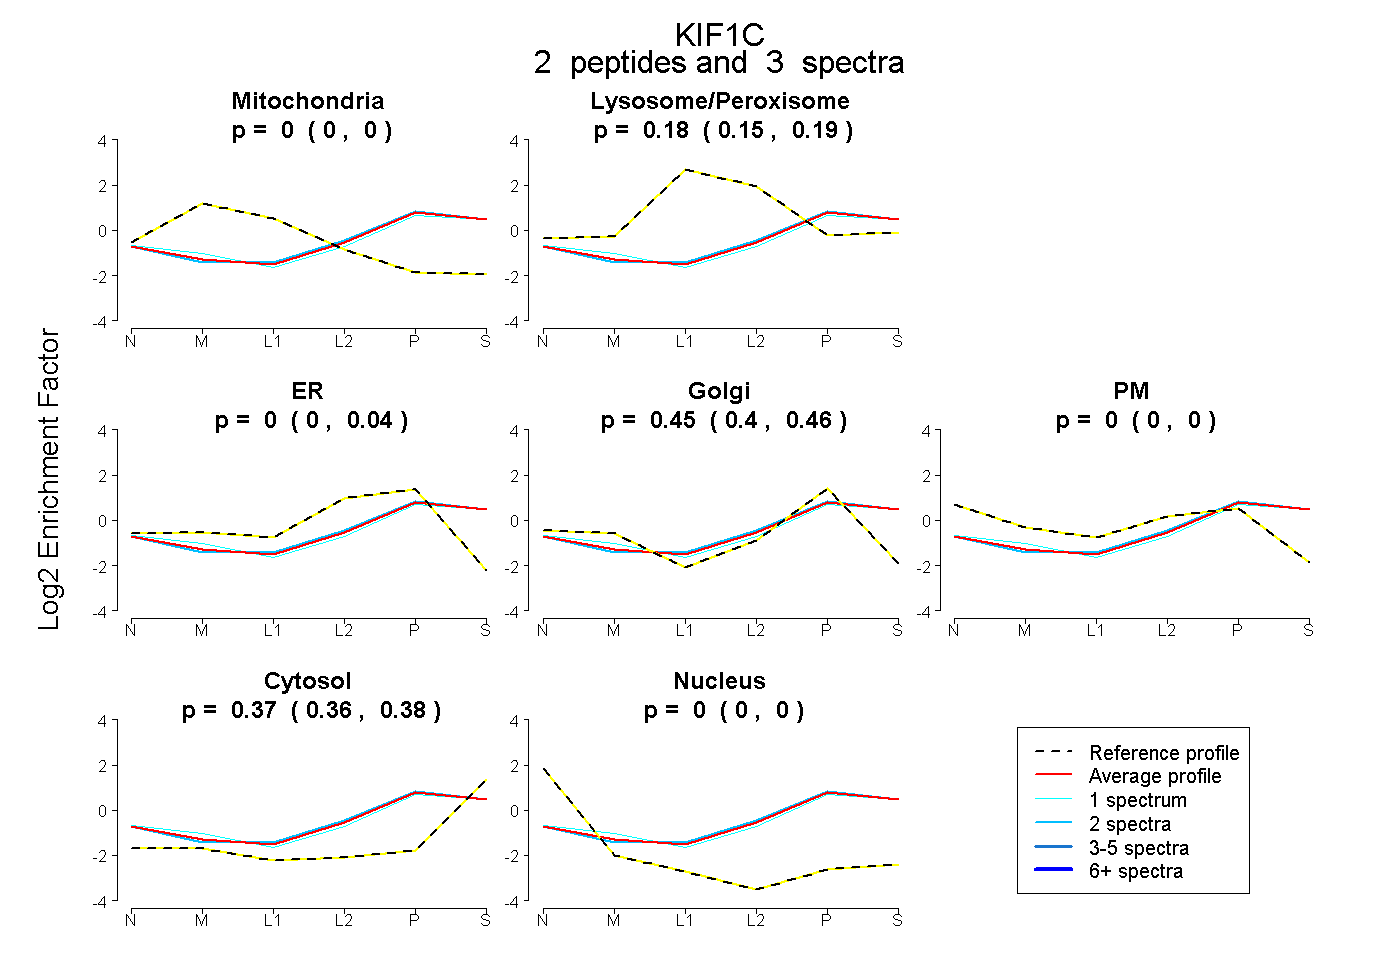
0.000 | 0.000
0.151 | 0.189
0.000 | 0.040
0.404 | 0.463
0.000 | 0.000
0.357 | 0.385
0.000 | 0.000
4peptides
spectra
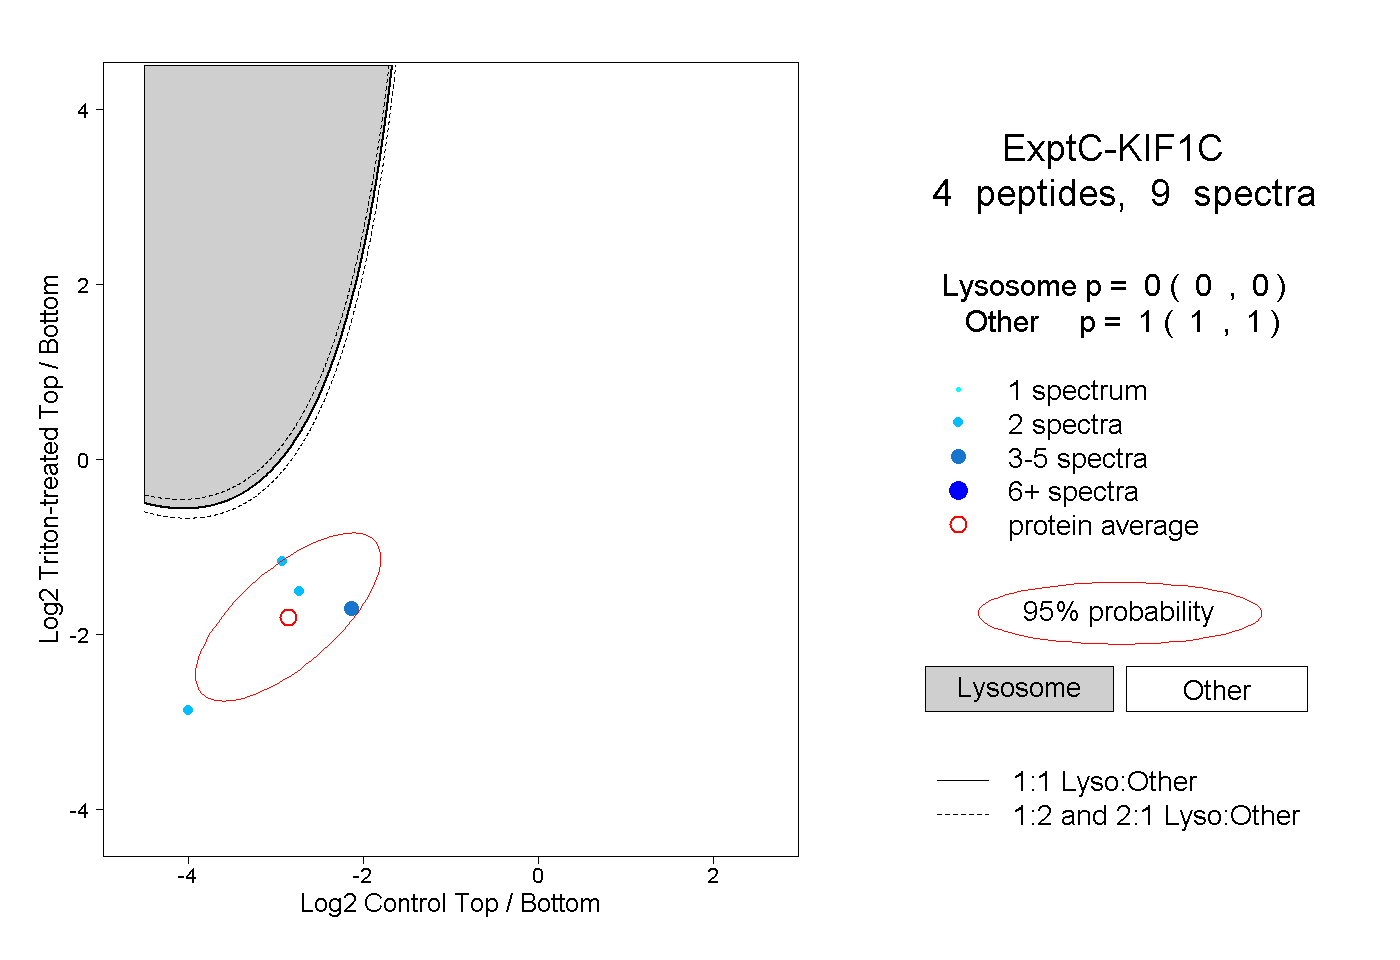
0.000 | 0.000
1.000 | 1.000
2peptides
spectra
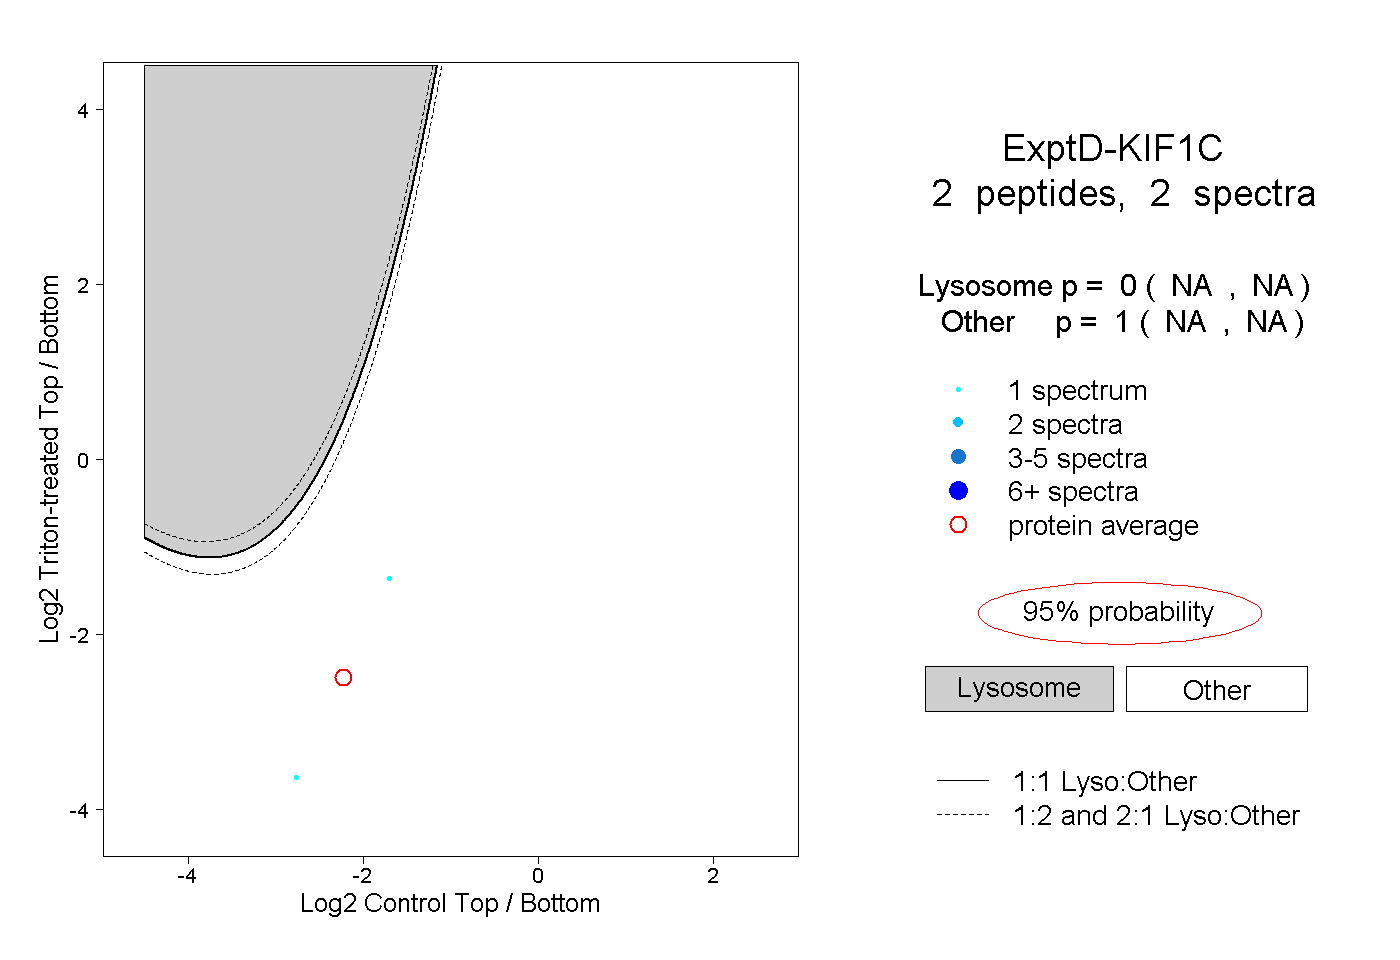
NA | NA
NA | NA