 41
41peptides
spectra
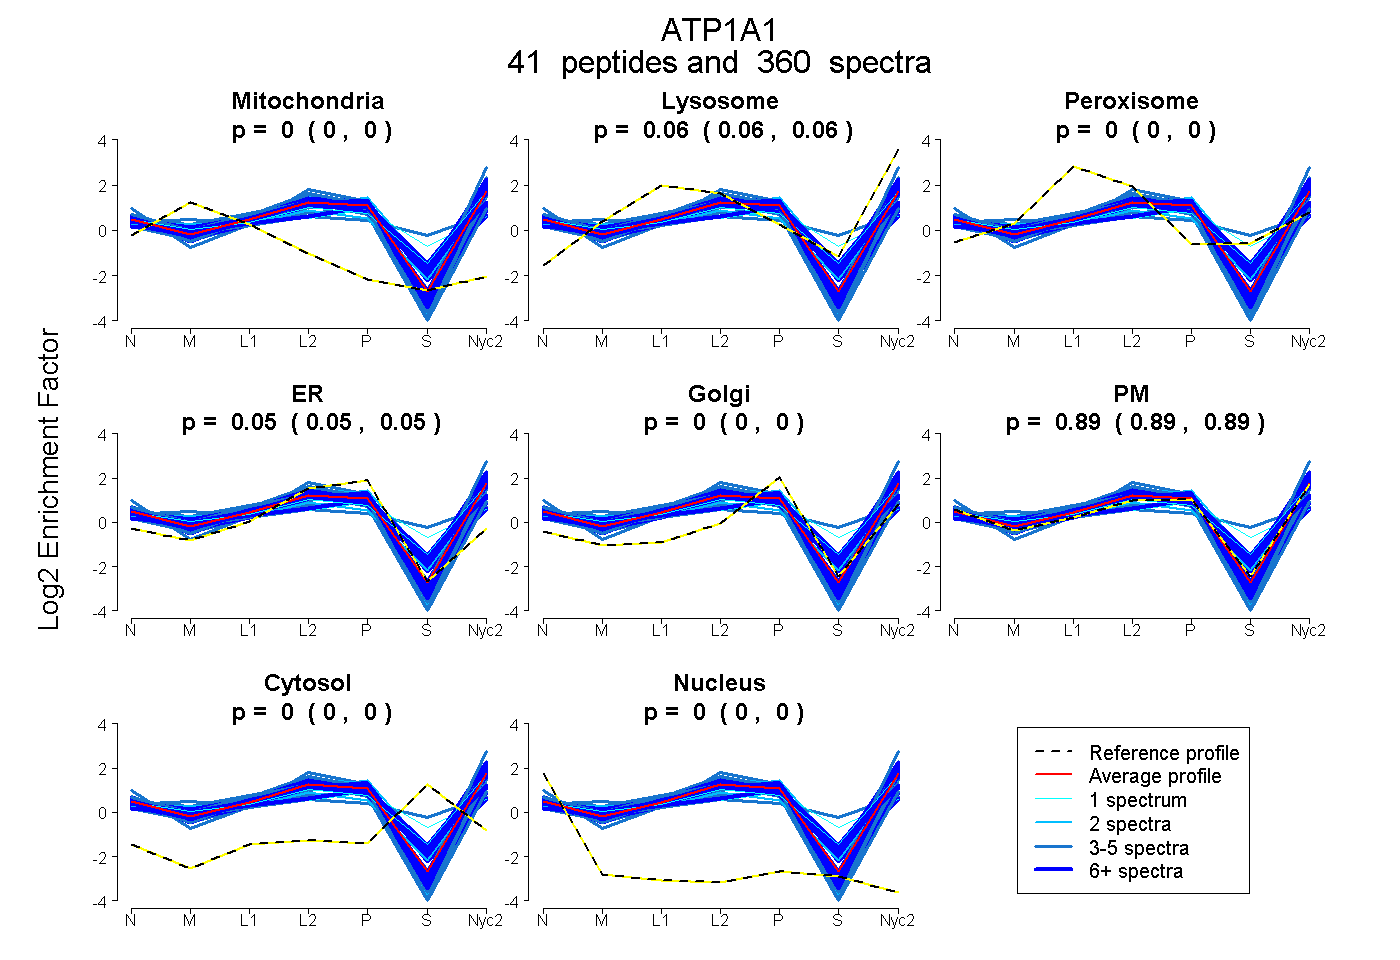
0.000 | 0.000
0.059 | 0.061
0.000 | 0.000
0.046 | 0.051
0.000 | 0.000
0.888 | 0.893
0.000 | 0.000
0.000 | 0.000
30peptides
spectra
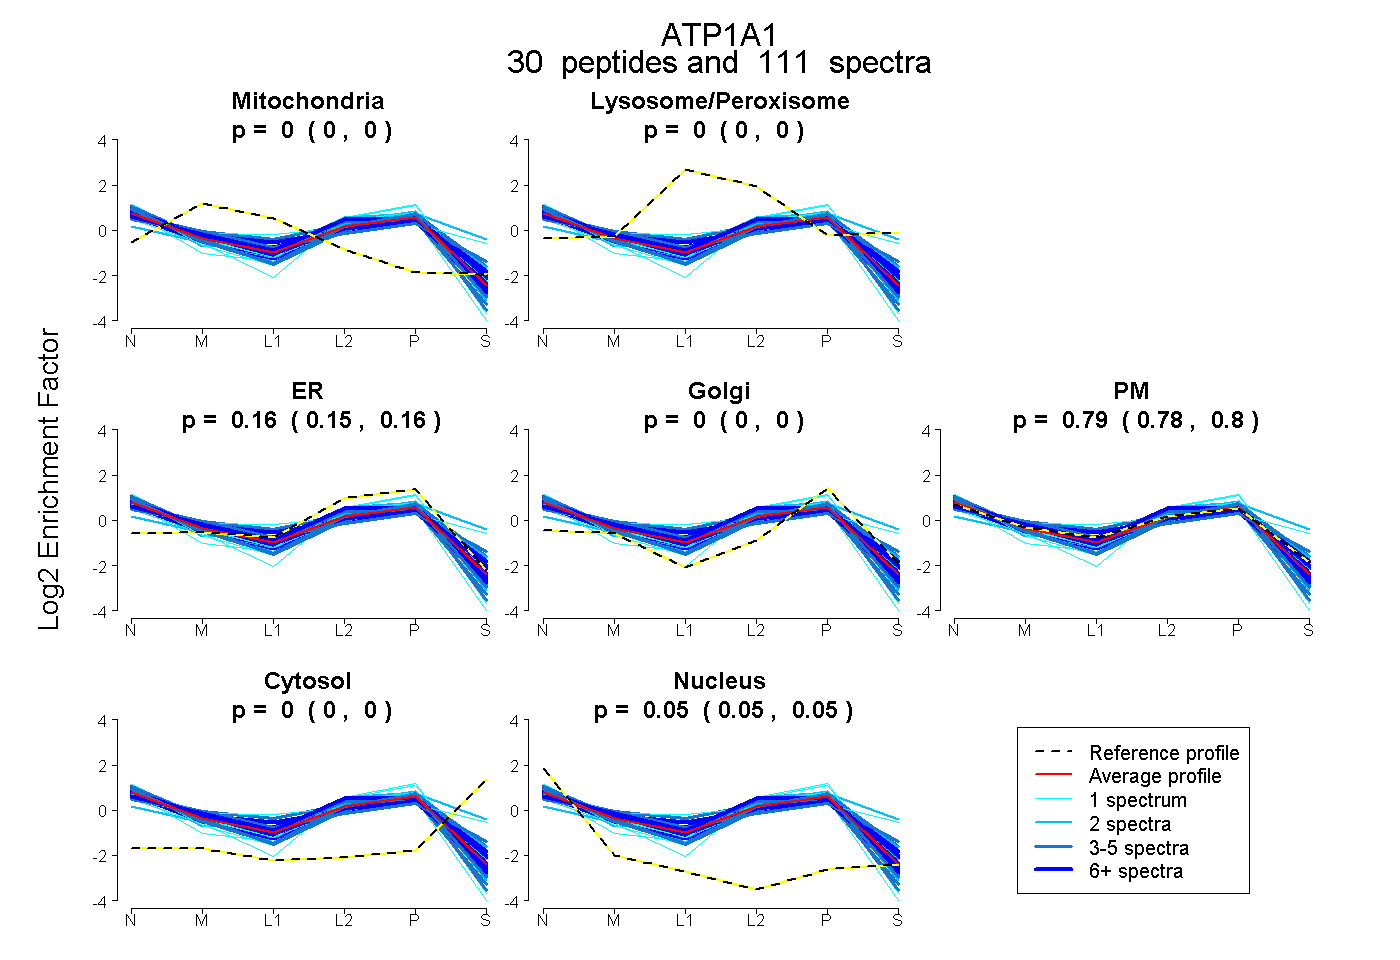
0.000 | 0.000
0.000 | 0.000
0.148 | 0.162
0.000 | 0.000
0.783 | 0.801
0.000 | 0.000
0.050 | 0.054
37peptides
spectra
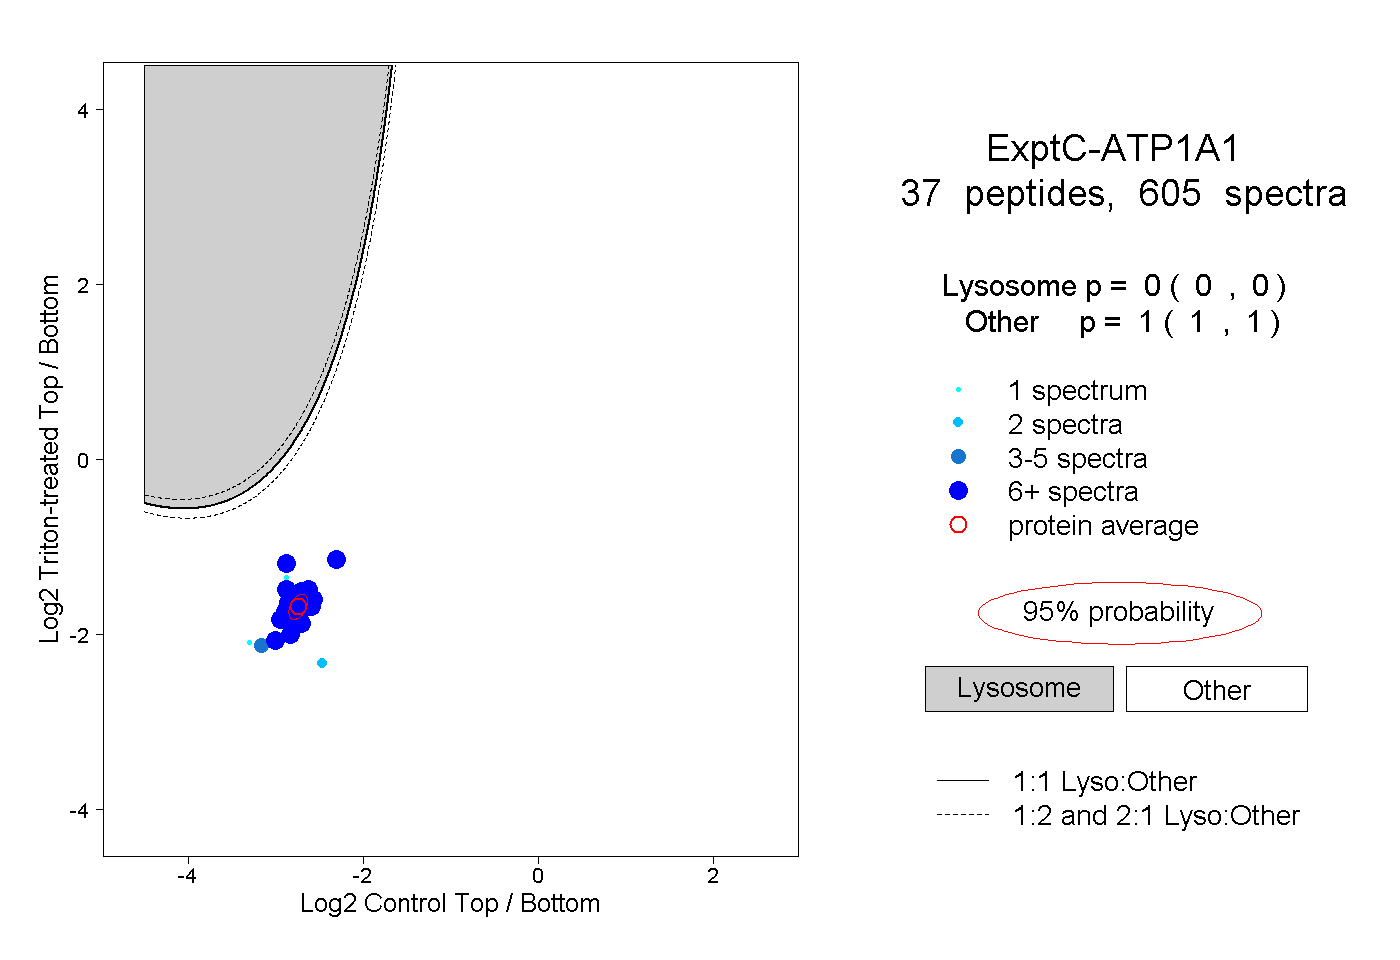
0.000 | 0.000
1.000 | 1.000
21peptides
spectra
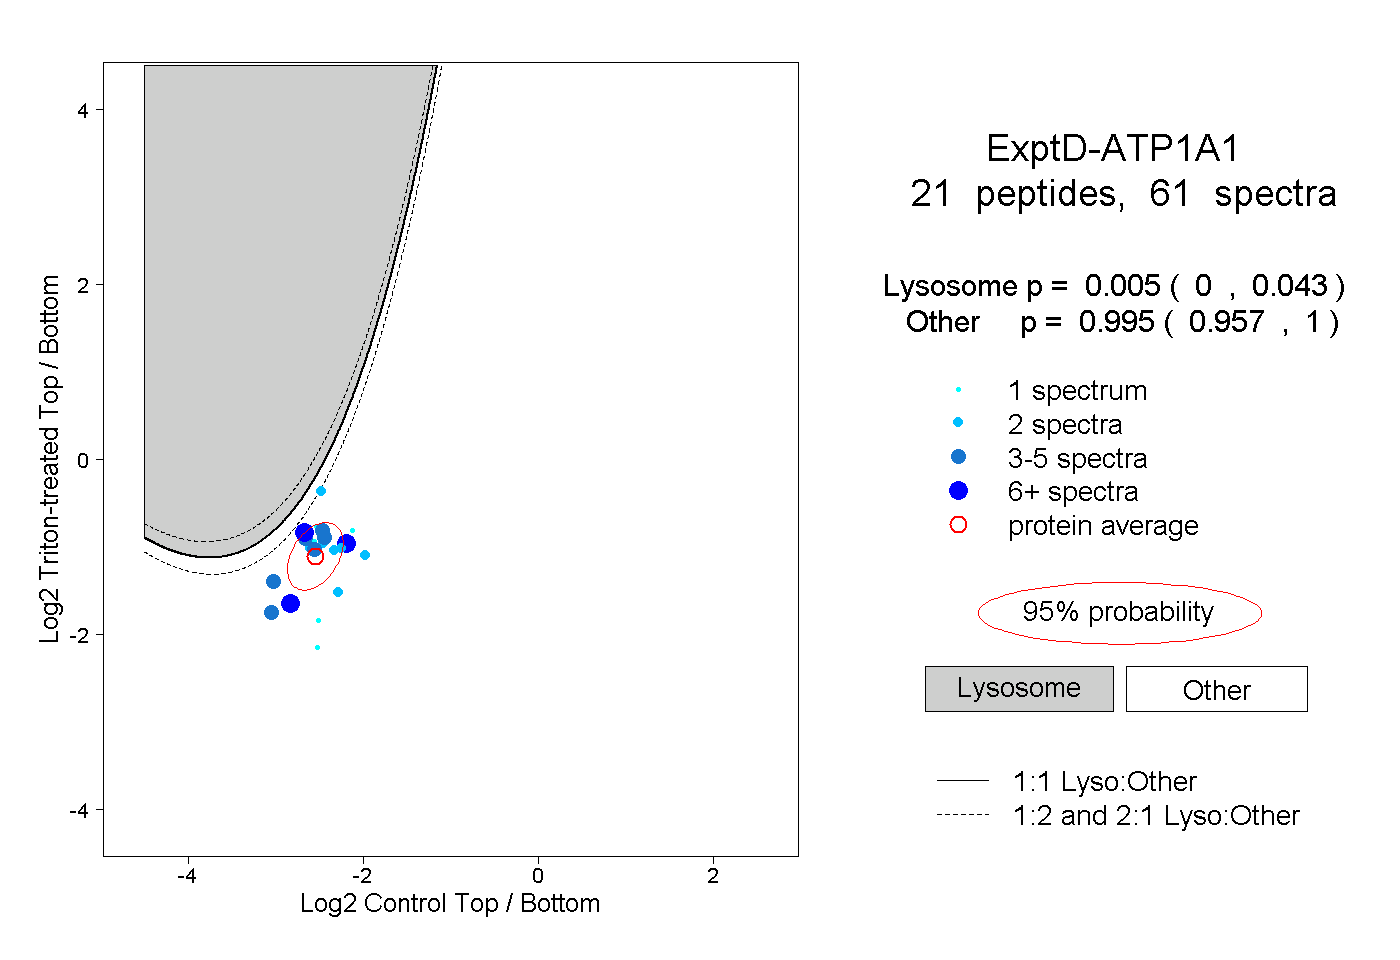
0.000 | 0.043
0.957 | 1.000