 5
5peptides
spectra
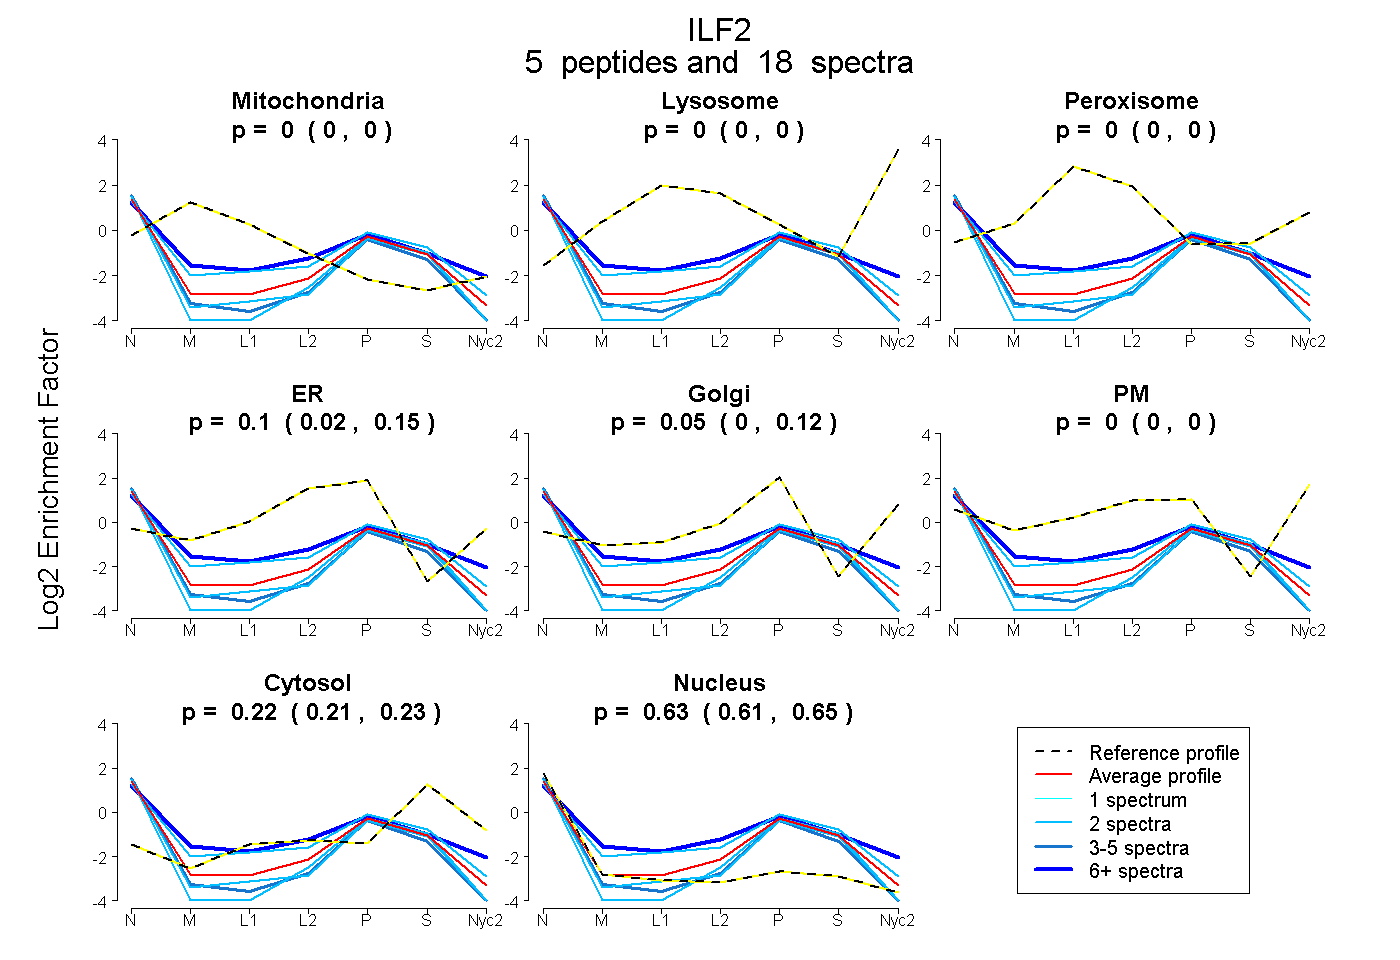
0.000 | 0.000
0.000 | 0.000
0.000 | 0.000
0.021 | 0.153
0.000 | 0.122
0.000 | 0.000
0.206 | 0.228
0.611 | 0.647
| Plot | Mito | Lyso | Perox | ER | Golgi | PM | Cytosol | Nucleus | |||||
| Expt A |
5 peptides |
18 spectra |
|
0.000 0.000 | 0.000 |
0.000 0.000 | 0.000 |
0.000 0.000 | 0.000 |
0.100 0.021 | 0.153 |
0.050 0.000 | 0.122 |
0.000 0.000 | 0.000 |
0.218 0.206 | 0.228 |
0.631 0.611 | 0.647 |
| 2 spectra, QPLALNVAYR | 0.000 | 0.000 | 0.000 | 0.000 | 0.038 | 0.000 | 0.213 | 0.748 | ||
| 2 spectra, QVGSYK | 0.000 | 0.000 | 0.000 | 0.261 | 0.000 | 0.000 | 0.261 | 0.479 | ||
| 8 spectra, ILSHGGFR | 0.000 | 0.000 | 0.000 | 0.296 | 0.012 | 0.039 | 0.236 | 0.417 | ||
| 4 spectra, ILITTVPPNLR | 0.000 | 0.000 | 0.000 | 0.000 | 0.057 | 0.000 | 0.160 | 0.783 | ||
| 2 spectra, VKPAPDETSFSEALLK | 0.000 | 0.000 | 0.000 | 0.000 | 0.001 | 0.000 | 0.234 | 0.765 |
| Plot | Lyso | Other | |||||||||||
| Expt C |
1 peptide |
2 spectra |
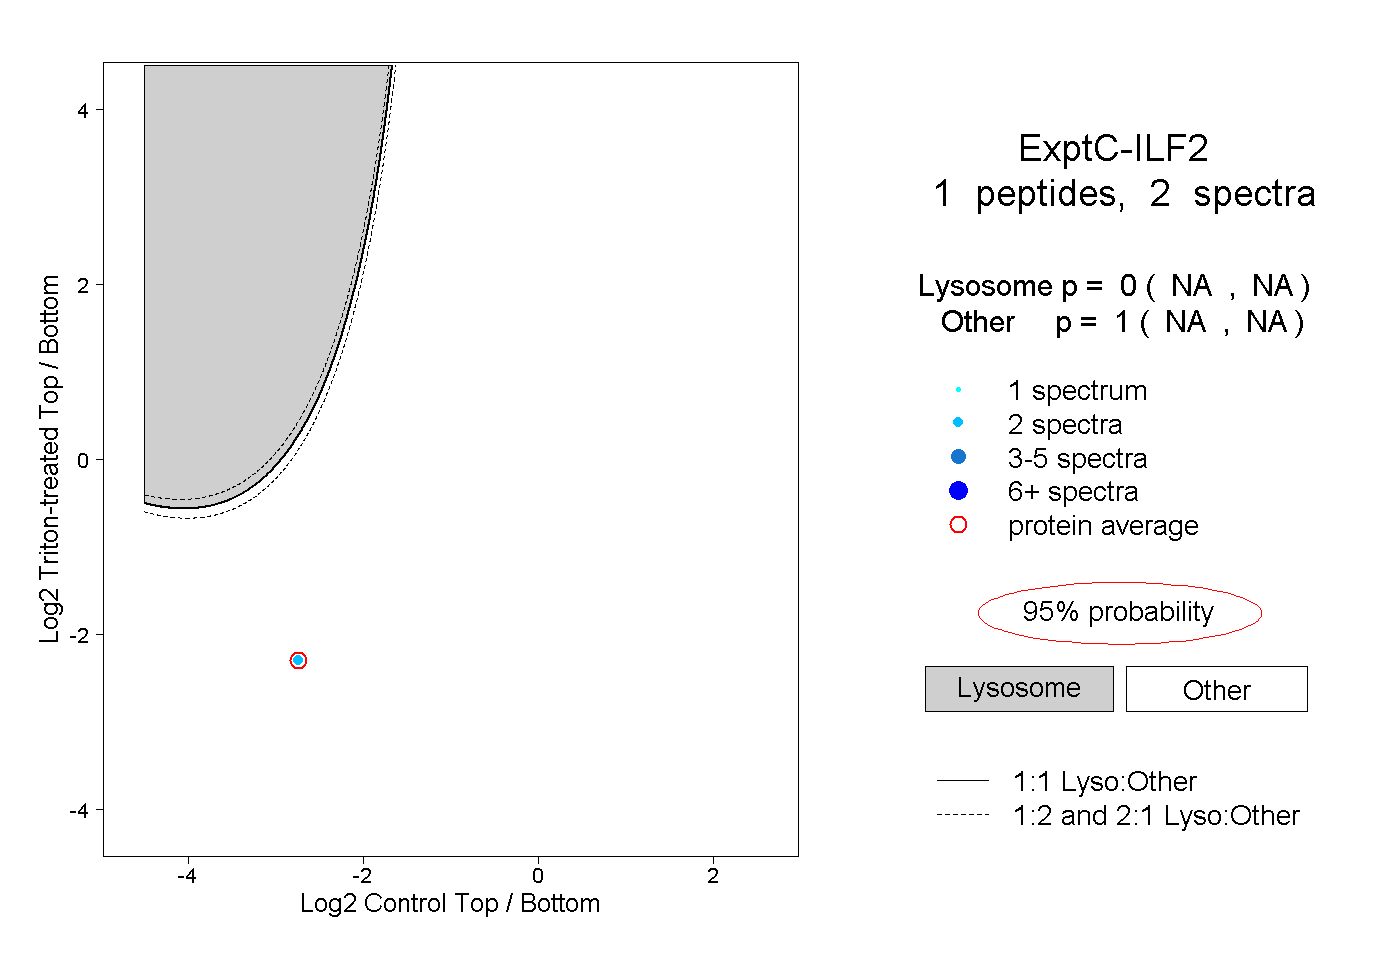 |
0.000 NA | NA |
1.000 NA | NA |