 6
6peptides
spectra
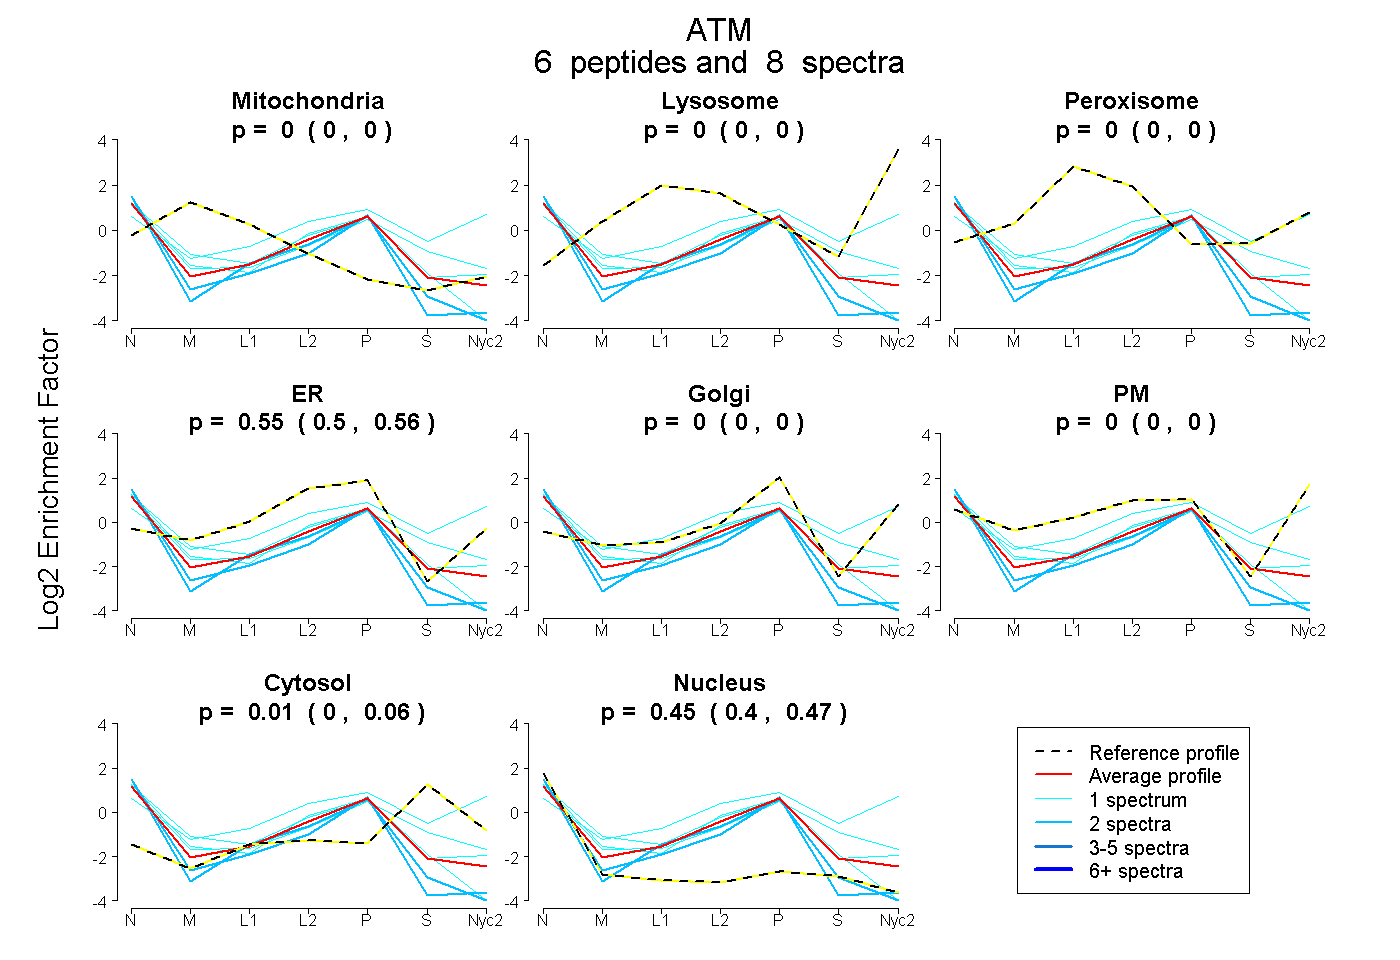
0.000 | 0.000
0.000 | 0.000
0.000 | 0.000
0.502 | 0.562
0.000 | 0.004
0.000 | 0.000
0.000 | 0.061
0.398 | 0.472
| Plot | Mito | Lyso | Perox | ER | Golgi | PM | Cytosol | Nucleus | |||||
| Expt A |
6 peptides |
8 spectra |
|
0.000 0.000 | 0.000 |
0.000 0.000 | 0.000 |
0.000 0.000 | 0.000 |
0.546 0.502 | 0.562 |
0.000 0.000 | 0.004 |
0.000 0.000 | 0.000 |
0.007 0.000 | 0.061 |
0.447 0.398 | 0.472 |
| 1 spectrum, AFLSLAR | 0.000 | 0.000 | 0.000 | 0.490 | 0.000 | 0.000 | 0.000 | 0.510 | ||
| 2 spectra, SNVSASTQTSR | 0.000 | 0.000 | 0.000 | 0.408 | 0.000 | 0.000 | 0.000 | 0.592 | ||
| 1 spectrum, IASGFFLR | 0.000 | 0.000 | 0.000 | 0.373 | 0.081 | 0.000 | 0.235 | 0.311 | ||
| 2 spectra, IIHAVTR | 0.000 | 0.000 | 0.000 | 0.423 | 0.000 | 0.000 | 0.000 | 0.577 | ||
| 1 spectrum, WAILNVK | 0.000 | 0.000 | 0.000 | 0.009 | 0.085 | 0.575 | 0.332 | 0.000 | ||
| 1 spectrum, FLDPAVWFEK | 0.000 | 0.000 | 0.000 | 0.610 | 0.000 | 0.000 | 0.000 | 0.390 |
| Plot | Lyso | Other | |||||||||||
| Expt C |
1 peptide |
1 spectrum |
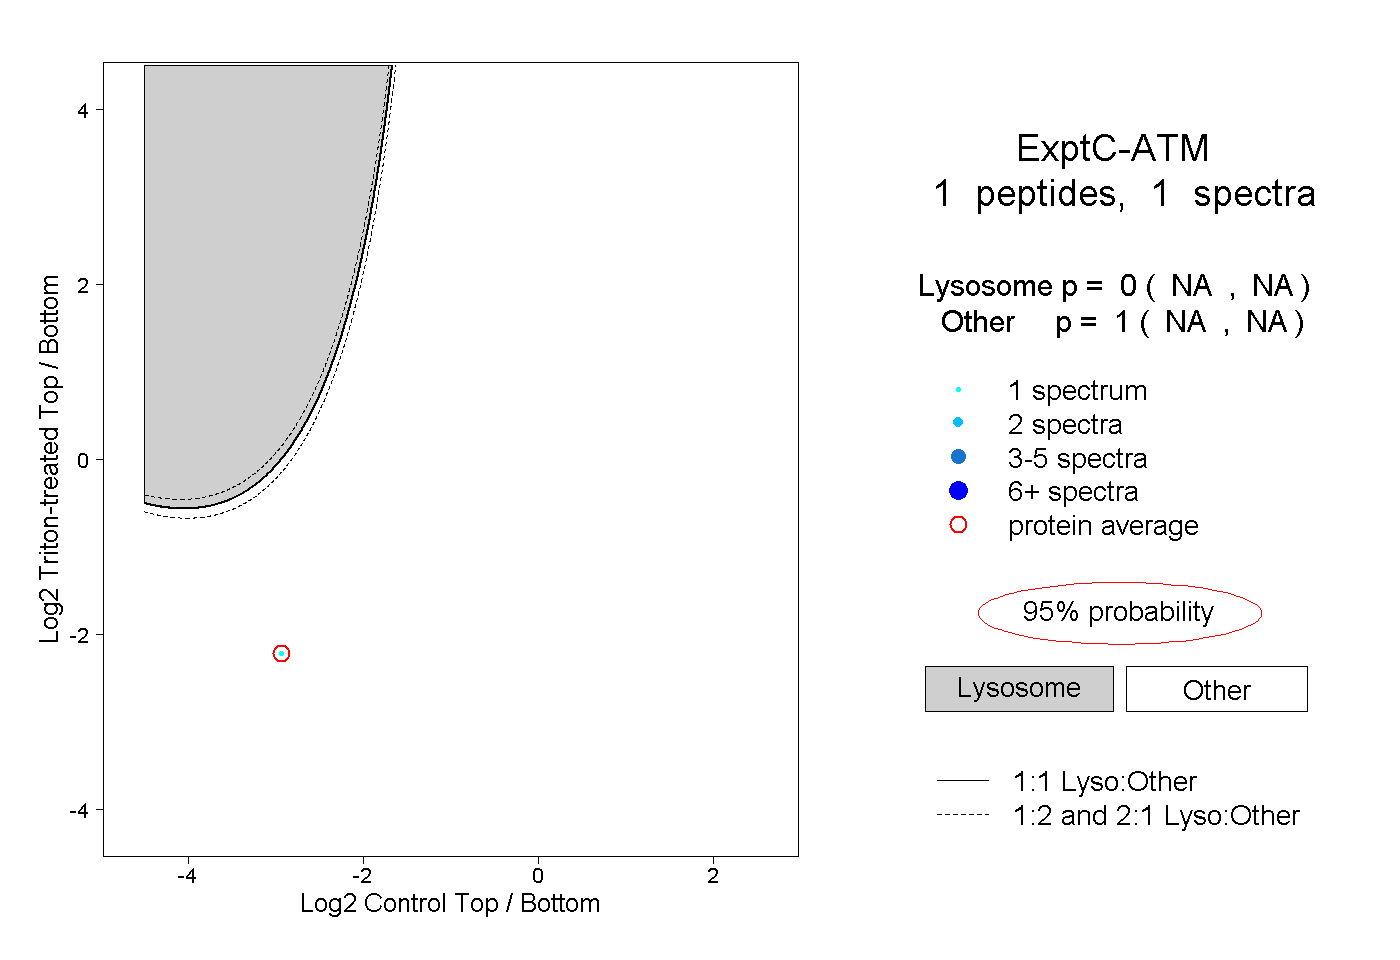 |
0.000 NA | NA |
1.000 NA | NA |