 4
4peptides
spectra
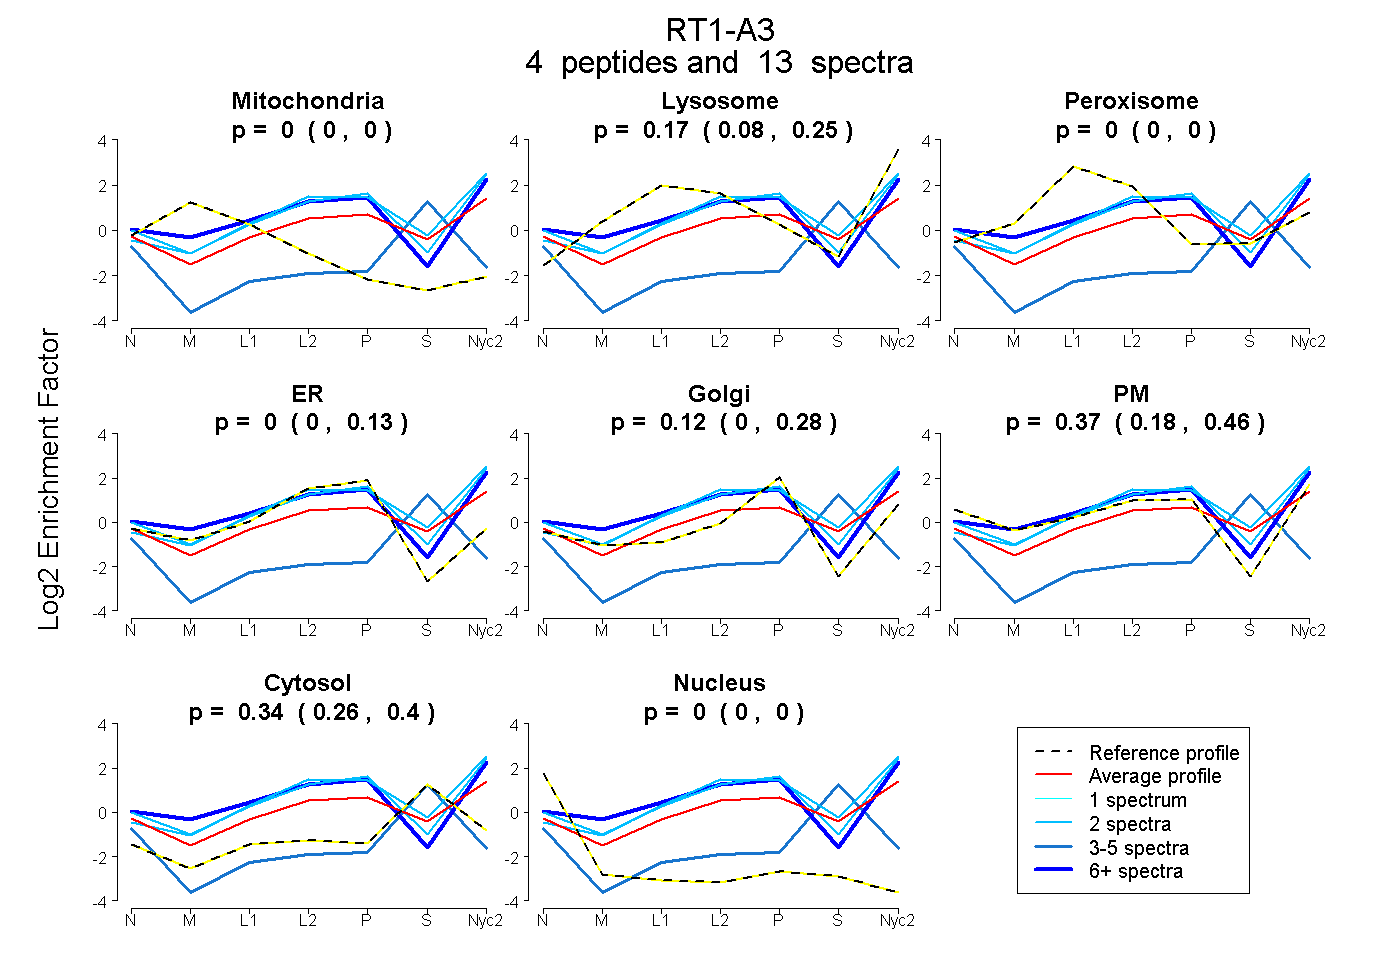
0.000 | 0.000
0.083 | 0.251
0.000 | 0.000
0.000 | 0.132
0.000 | 0.278
0.180 | 0.463
0.263 | 0.398
0.000 | 0.000
2peptides
spectra
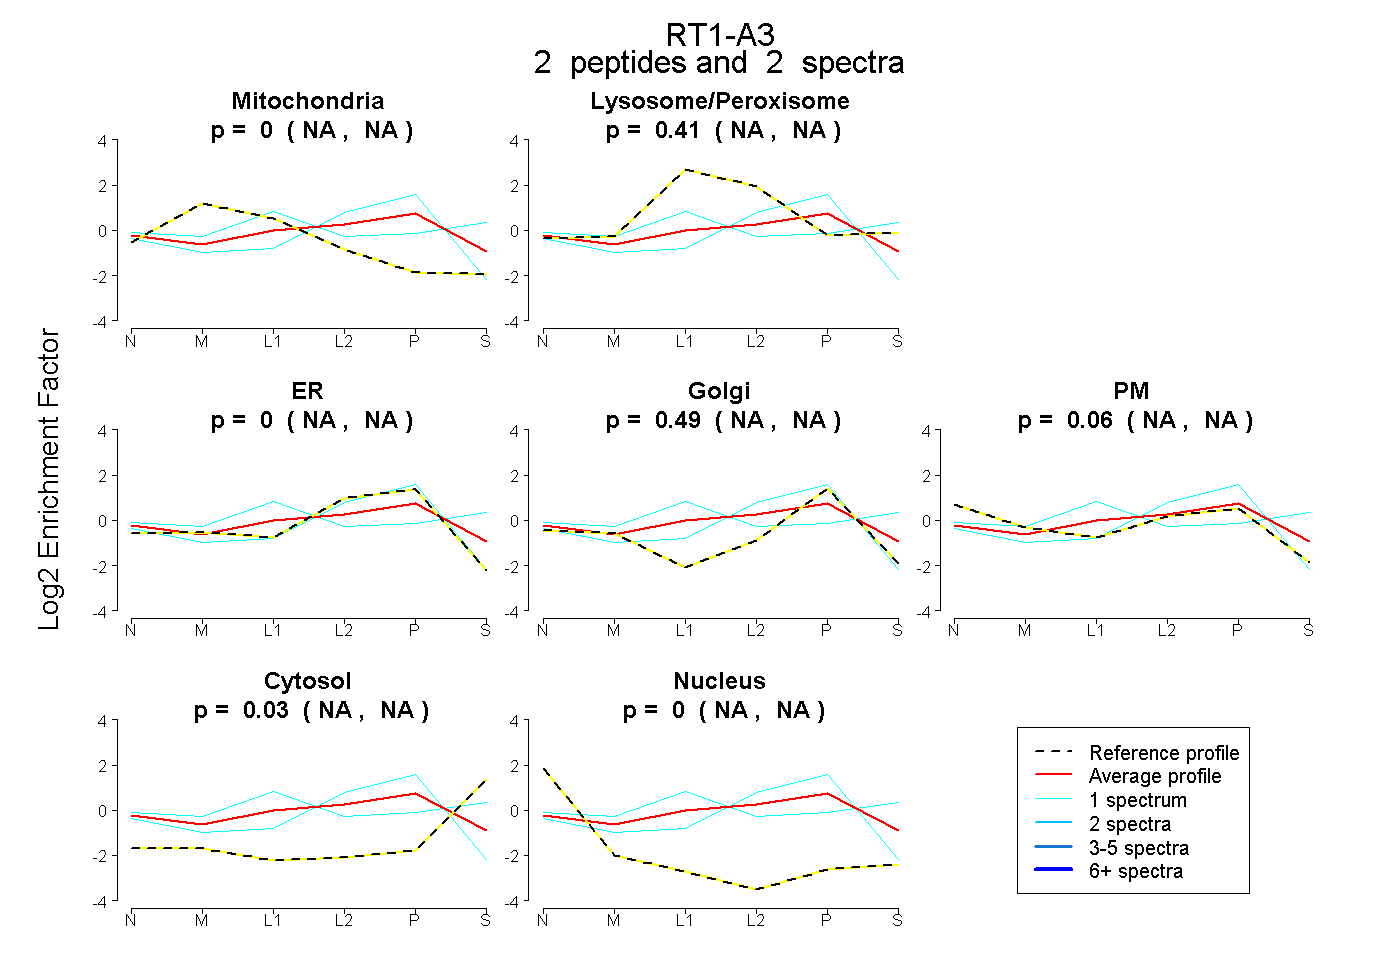
NA | NA
NA | NA
NA | NA
NA | NA
NA | NA
NA | NA
NA | NA
5peptides
spectra
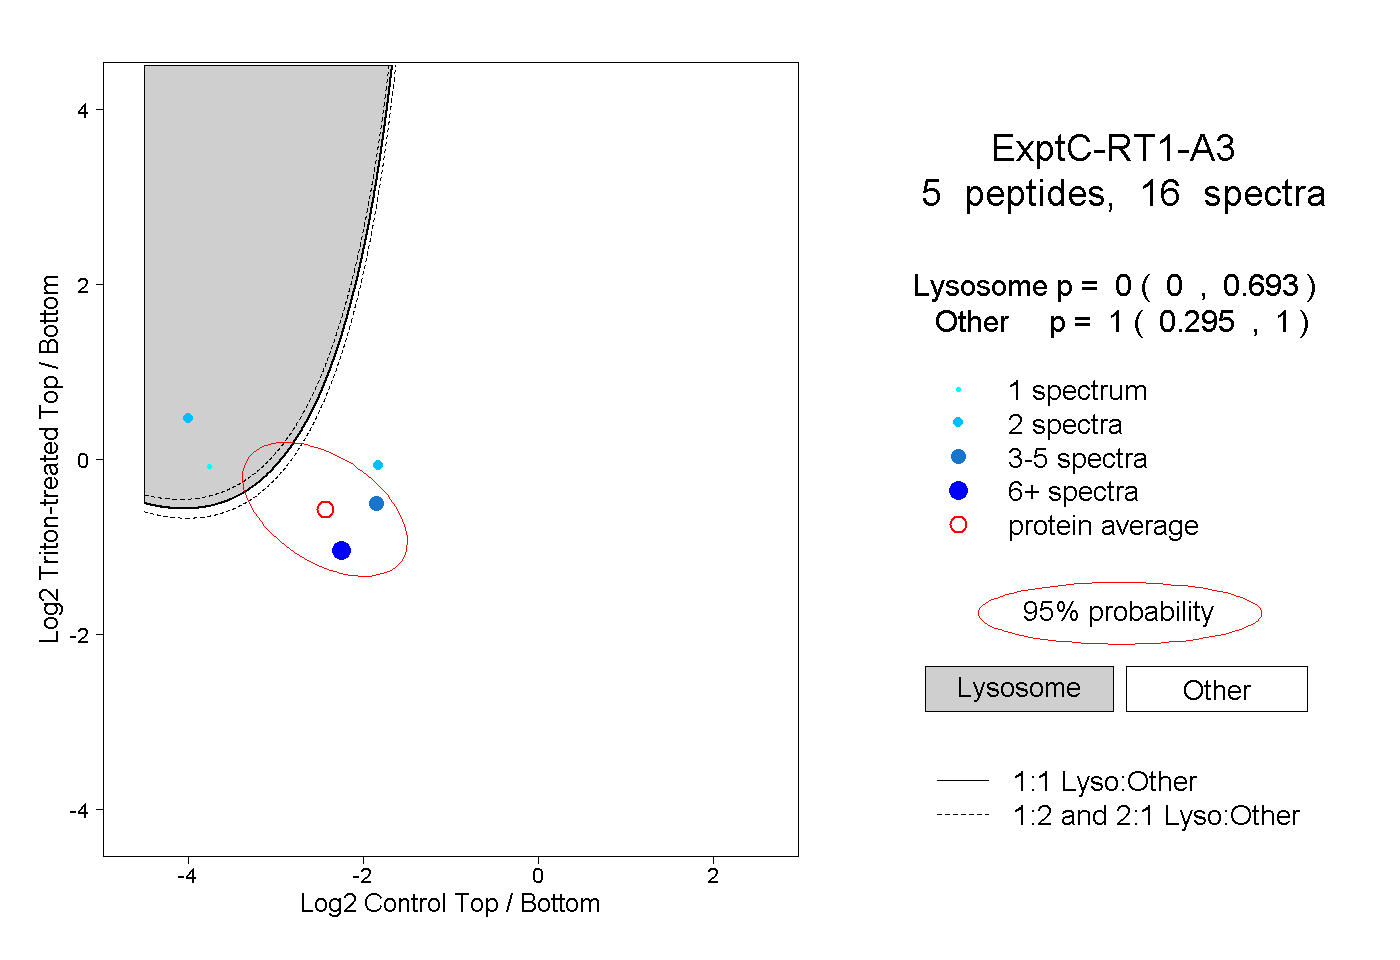
0.000 | 0.693
0.295 | 1.000
2peptides
spectra
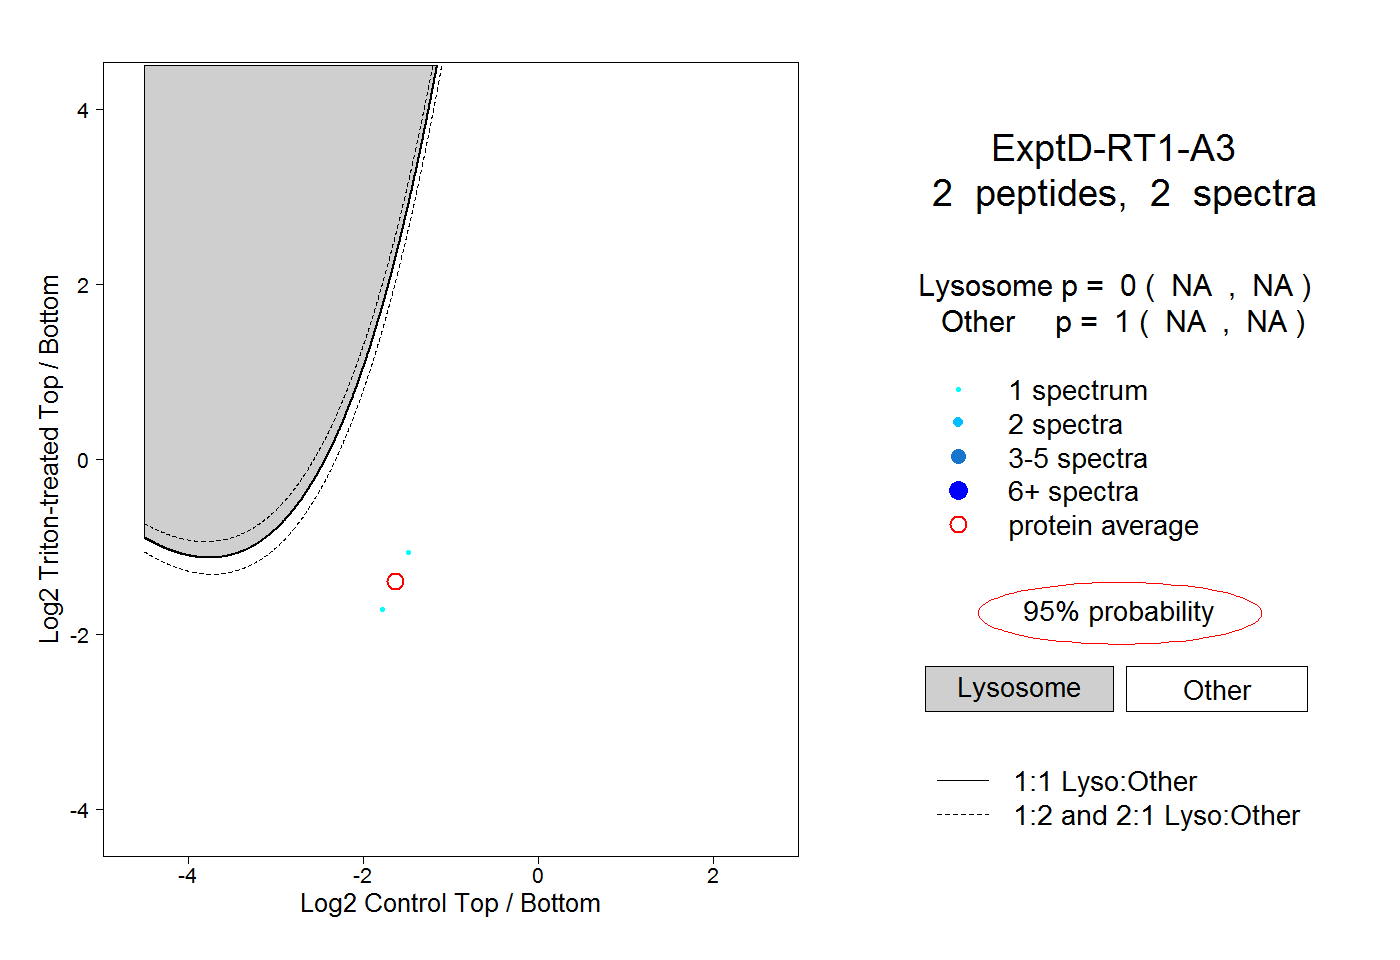
NA | NA
NA | NA