PTPLAD1
[ENSRNOP00000045049]
Main page
| | | Plot |
Mito |
Lyso |
|
Perox |
ER |
Golgi |
PM |
Cytosol |
Nucleus |
|
| Expt A |
 10
10
peptides |
43
spectra |
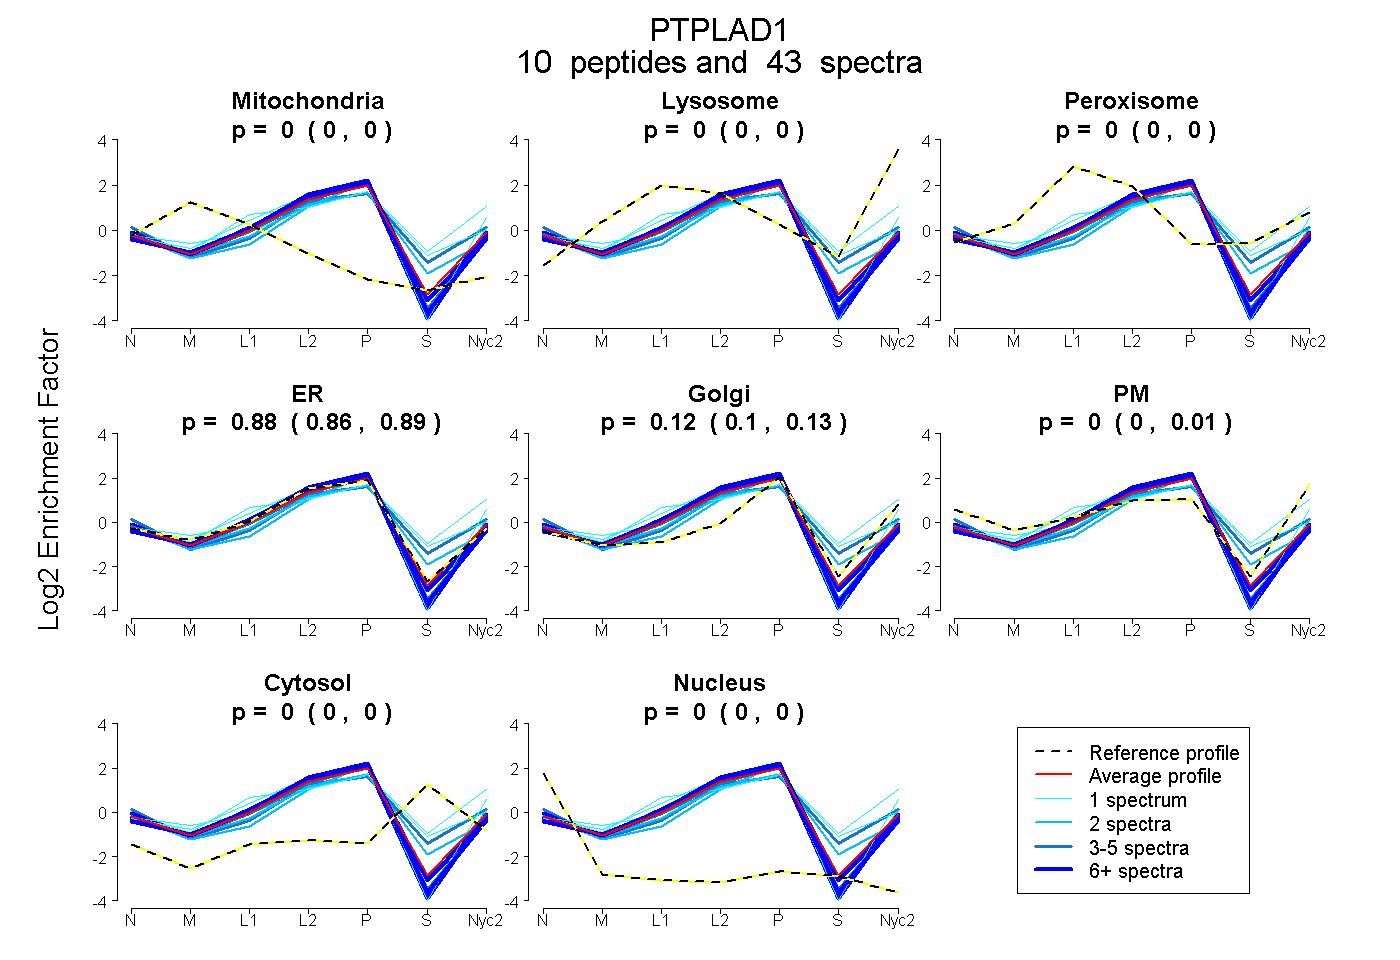 |
0.000
0.000 | 0.000 |
0.000
0.000 | 0.000 |
|
0.000
0.000 | 0.000 |
0.877
0.864 | 0.888 |
0.120
0.104 | 0.129 |
0.003
0.000 | 0.014 |
0.000
0.000 | 0.000 |
0.000
0.000 | 0.003 |
|
| | | Plot |
Mito |
|
Lyso or Perox |
|
ER |
Golgi |
PM |
Cytosol |
Nucleus |
|
| Expt B |
4
peptides |
15
spectra |
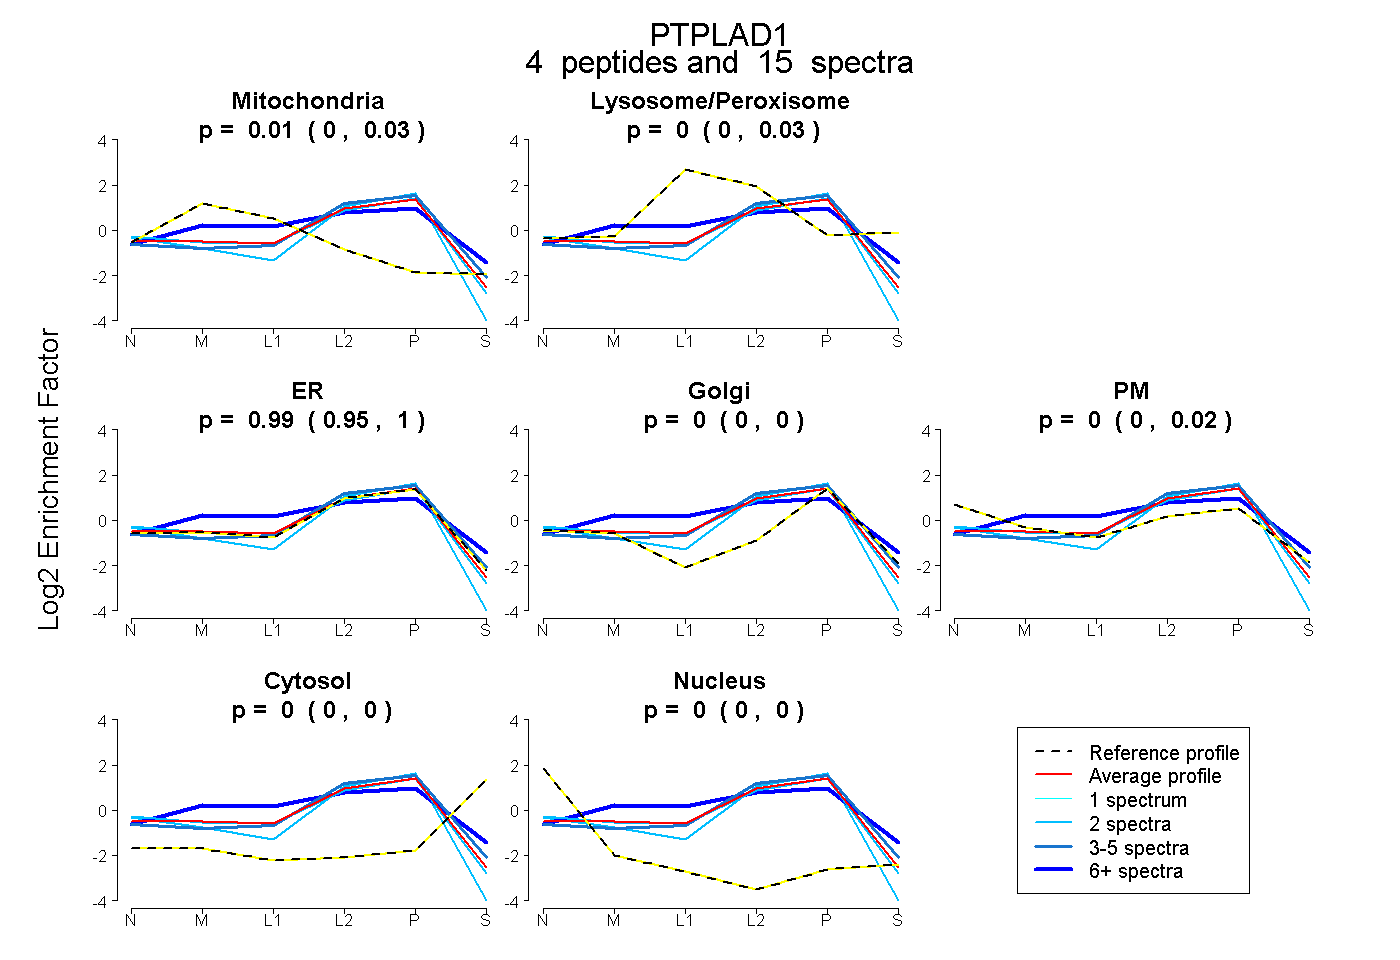 |
0.011
0.000 | 0.025 |
|
0.000
0.000 | 0.027 |
|
0.989
0.947 | 1.000 |
0.000
0.000 | 0.000 |
0.000
0.000 | 0.024 |
0.000
0.000 | 0.000 |
0.000
0.000 | 0.003 |
|
| 2 spectra, FSFTLPYPLR |
0.000 |
|
0.000 |
|
0.977 |
0.000 |
0.000 |
0.000 |
0.023 |
|
| 5 spectra, RPLFLAPDFDR |
0.000 |
|
0.022 |
|
0.978 |
0.000 |
0.000 |
0.000 |
0.000 |
|
| 6 spectra, GSHWWER |
0.089 |
|
0.279 |
|
0.484 |
0.147 |
0.000 |
0.000 |
0.000 |
|
| 2 spectra, QVNITVQK |
0.000 |
|
0.000 |
|
0.926 |
0.000 |
0.073 |
0.000 |
0.001 |
|
| | | Plot |
|
Lyso |
|
|
|
|
|
|
|
Other |
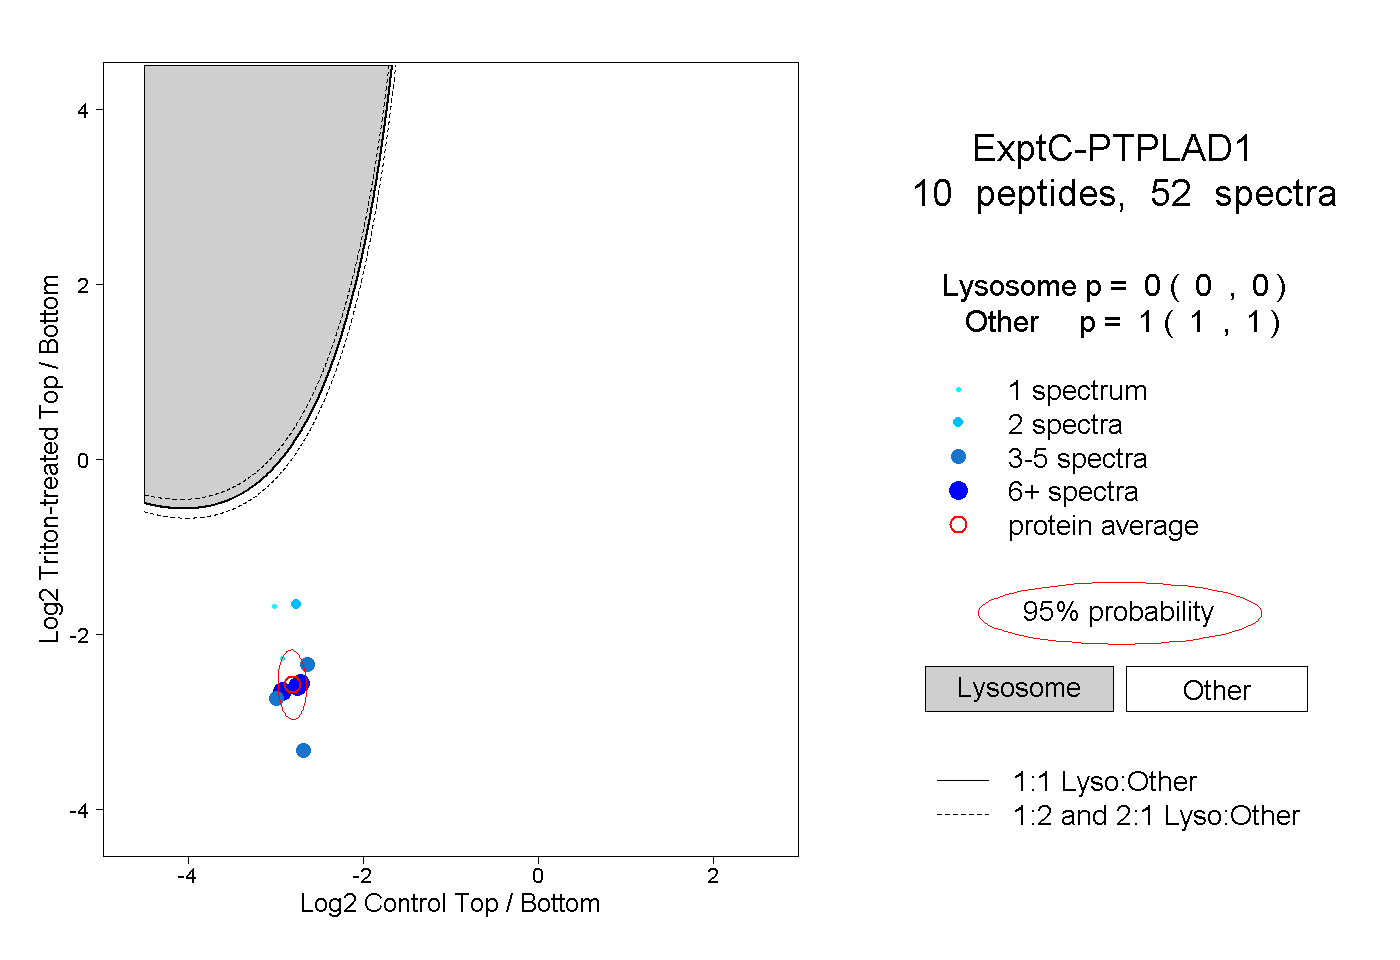
| Expt C |
10
peptides |
52
spectra |
 |
|
0.000
0.000 | 0.000 |
|
|
|
|
|
|
|
1.000
1.000 | 1.000 |
| | | Plot |
|
Lyso |
|
|
|
|
|
|
|
Other |
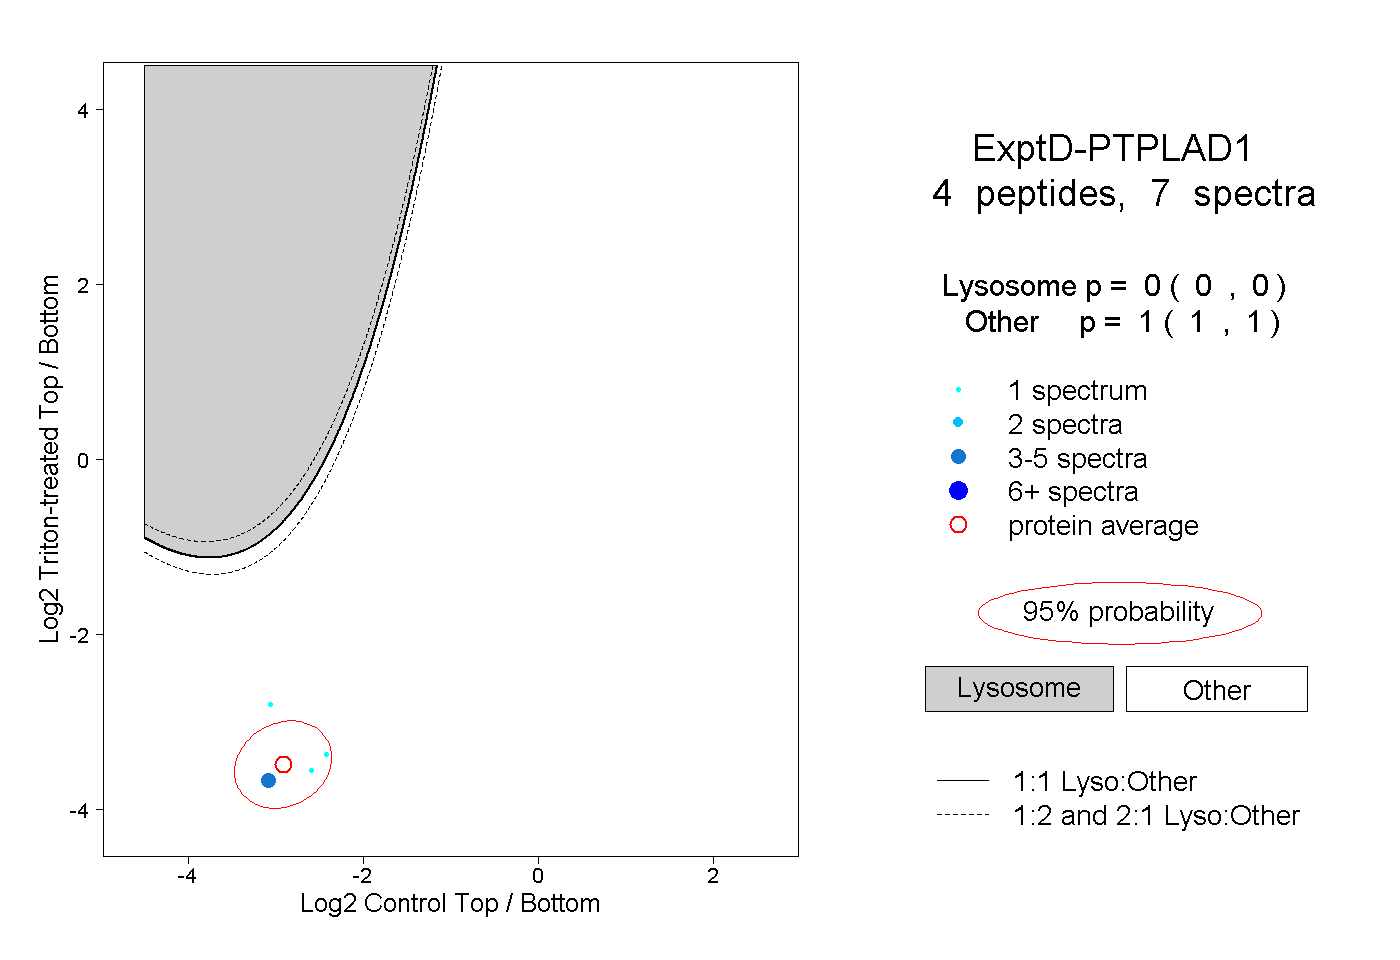
| Expt D |
4
peptides |
7
spectra |
 |
|
0.000
0.000 | 0.000 |
|
|
|
|
|
|
|
1.000
1.000 | 1.000 |