 7
7peptides
spectra
0.003 | 0.020
0.000 | 0.000
0.000 | 0.025
0.966 | 0.984
0.000 | 0.000
0.000 | 0.000
0.000 | 0.000
0.000 | 0.000
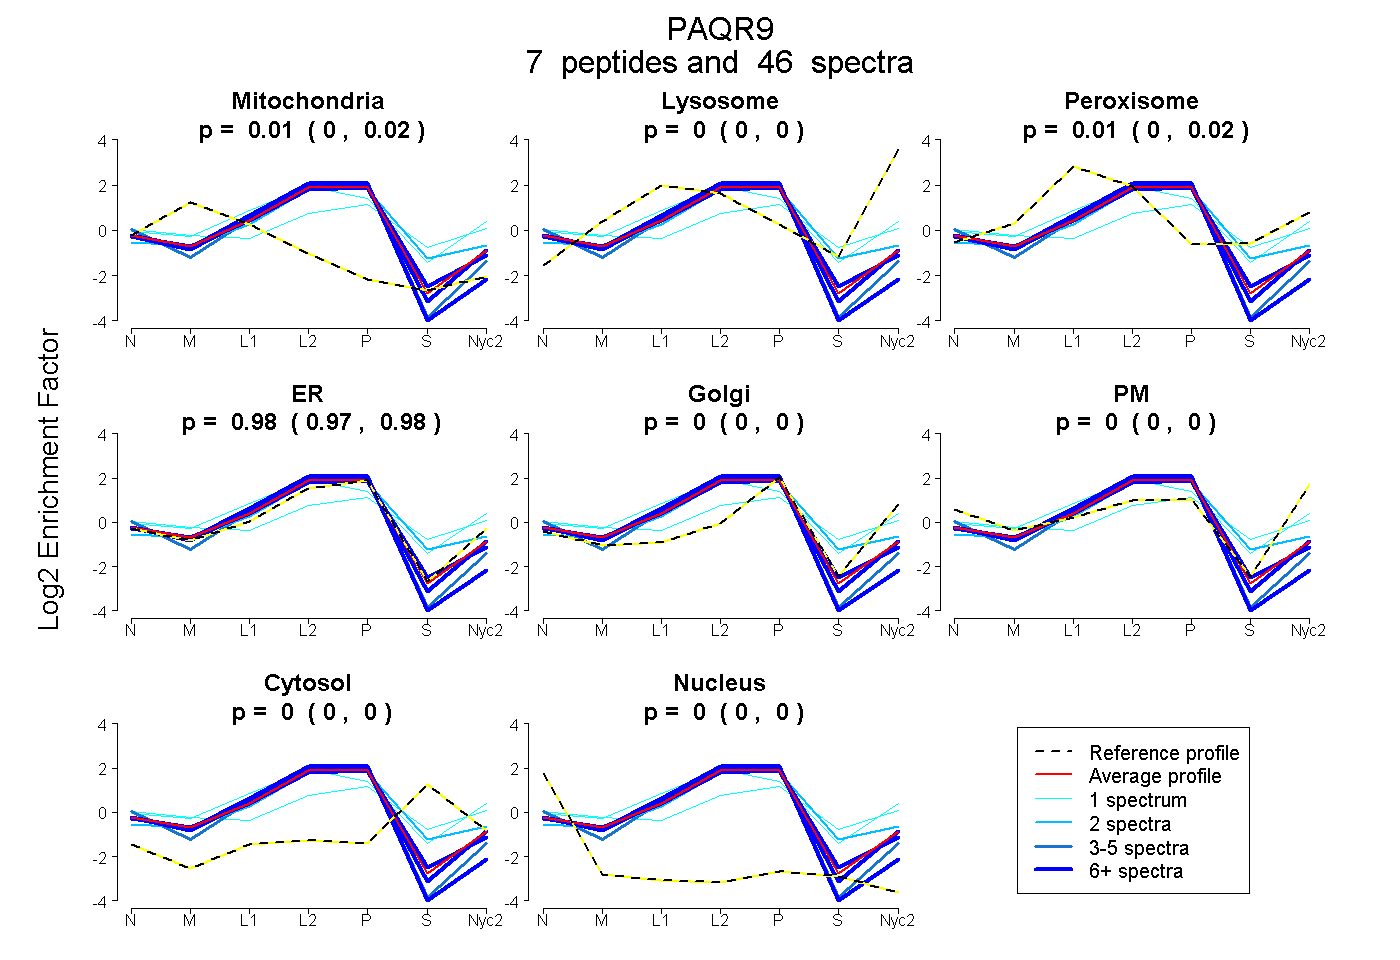
| Plot | Mito | Lyso | Perox | ER | Golgi | PM | Cytosol | Nucleus | |||||
| Expt A |
7 peptides |
46 spectra |
|
0.013 0.003 | 0.020 |
0.000 0.000 | 0.000 |
0.010 0.000 | 0.025 |
0.977 0.966 | 0.984 |
0.000 0.000 | 0.000 |
0.000 0.000 | 0.000 |
0.000 0.000 | 0.000 |
0.000 0.000 | 0.000 |
| 25 spectra, VMTPYVQQR | 0.004 | 0.000 | 0.000 | 0.996 | 0.000 | 0.000 | 0.000 | 0.000 | ||
| 1 spectrum, GENPTLFVHFYR | 0.000 | 0.000 | 0.109 | 0.348 | 0.090 | 0.230 | 0.222 | 0.000 | ||
| 6 spectra, TDWCSYPFALR | 0.051 | 0.000 | 0.000 | 0.949 | 0.000 | 0.000 | 0.000 | 0.000 | ||
| 8 spectra, LIAVYR | 0.033 | 0.000 | 0.017 | 0.950 | 0.000 | 0.000 | 0.000 | 0.000 | ||
| 2 spectra, LGWHVDCTR | 0.000 | 0.000 | 0.136 | 0.765 | 0.000 | 0.000 | 0.099 | 0.000 | ||
| 1 spectrum, FLNSTEFCSK | 0.000 | 0.020 | 0.318 | 0.574 | 0.000 | 0.088 | 0.000 | 0.000 | ||
| 3 spectra, GPPAPTSR | 0.000 | 0.000 | 0.000 | 0.976 | 0.000 | 0.000 | 0.000 | 0.024 |
| Plot | Mito | Lyso or Perox | ER | Golgi | PM | Cytosol | Nucleus | ||||||
| Expt B |
2 peptides |
5 spectra |
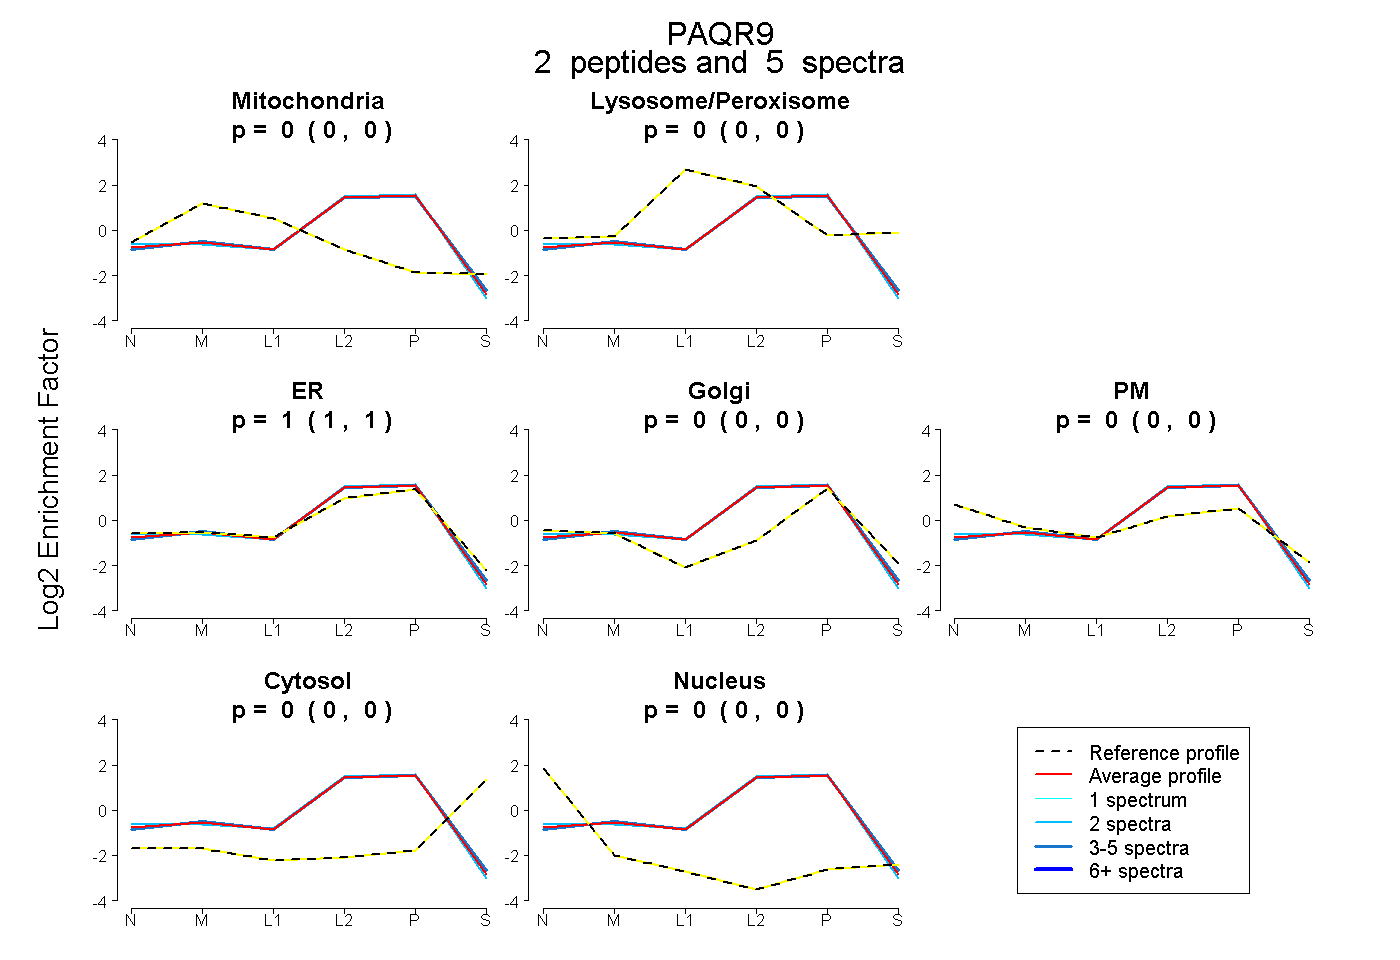 |
0.000 0.000 | 0.000 |
0.000 0.000 | 0.000 |
1.000 1.000 | 1.000 |
0.000 0.000 | 0.000 |
0.000 0.000 | 0.000 |
0.000 0.000 | 0.000 |
0.000 0.000 | 0.000 |
|||
| Plot | Lyso | Other | |||||||||||
| Expt C |
5 peptides |
16 spectra |
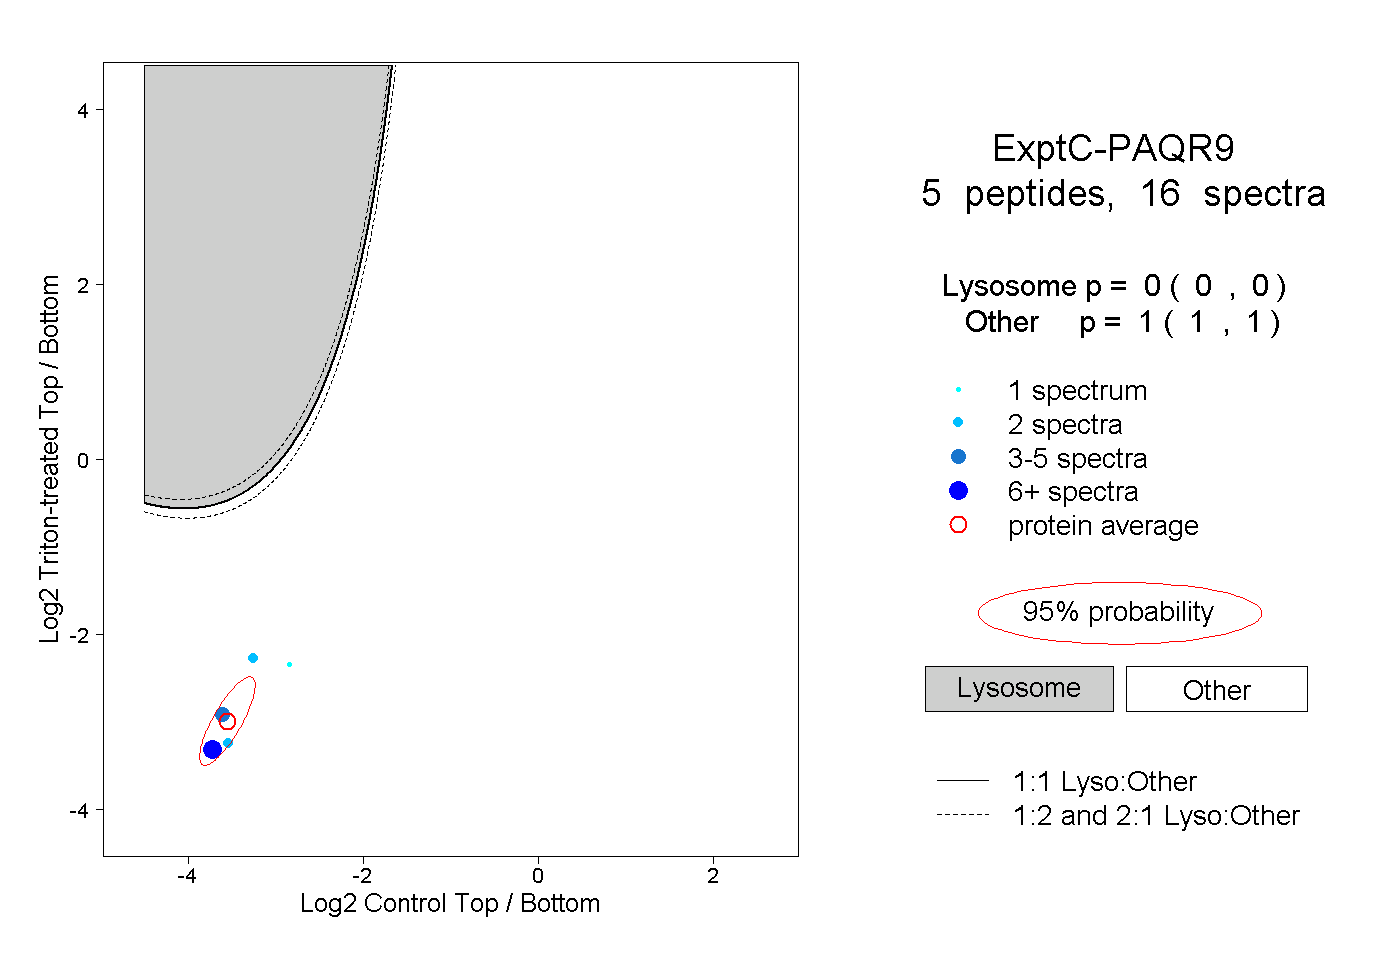 |
0.000 0.000 | 0.000 |
1.000 1.000 | 1.000 |
||||||||
| Plot | Lyso | Other | |||||||||||
| Expt D |
1 peptide |
2 spectra |
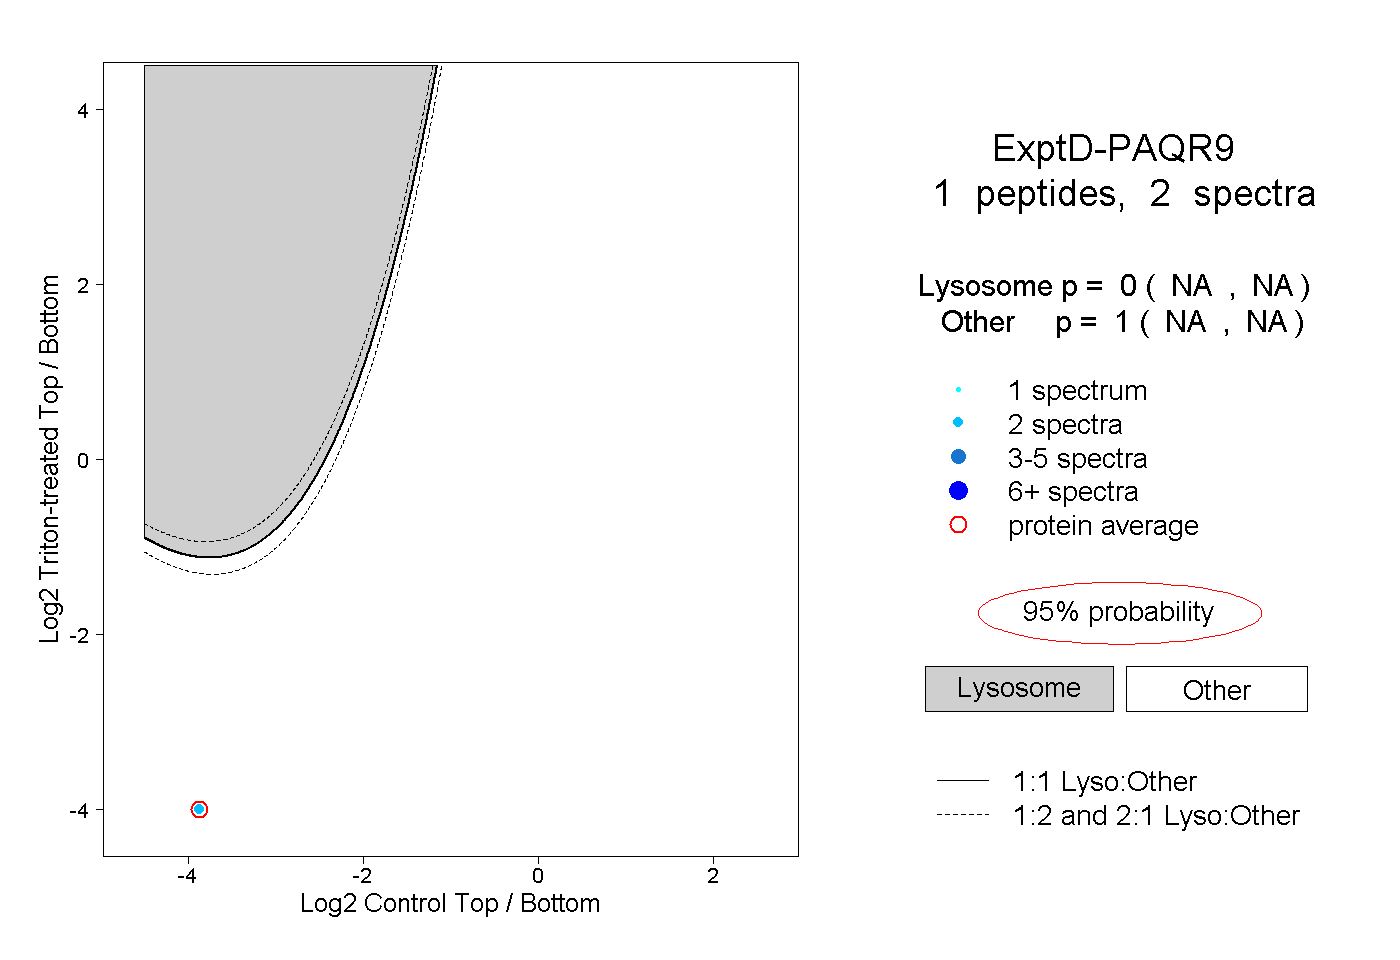 |
0.000 NA | NA |
1.000 NA | NA |