 6
6peptides
spectra
0.110 | 0.141
0.447 | 0.504
0.000 | 0.000
0.000 | 0.000
0.000 | 0.000
0.365 | 0.422
0.000 | 0.000
0.000 | 0.000
6peptides
spectra
0.000 | 0.000
1.000 | 1.000
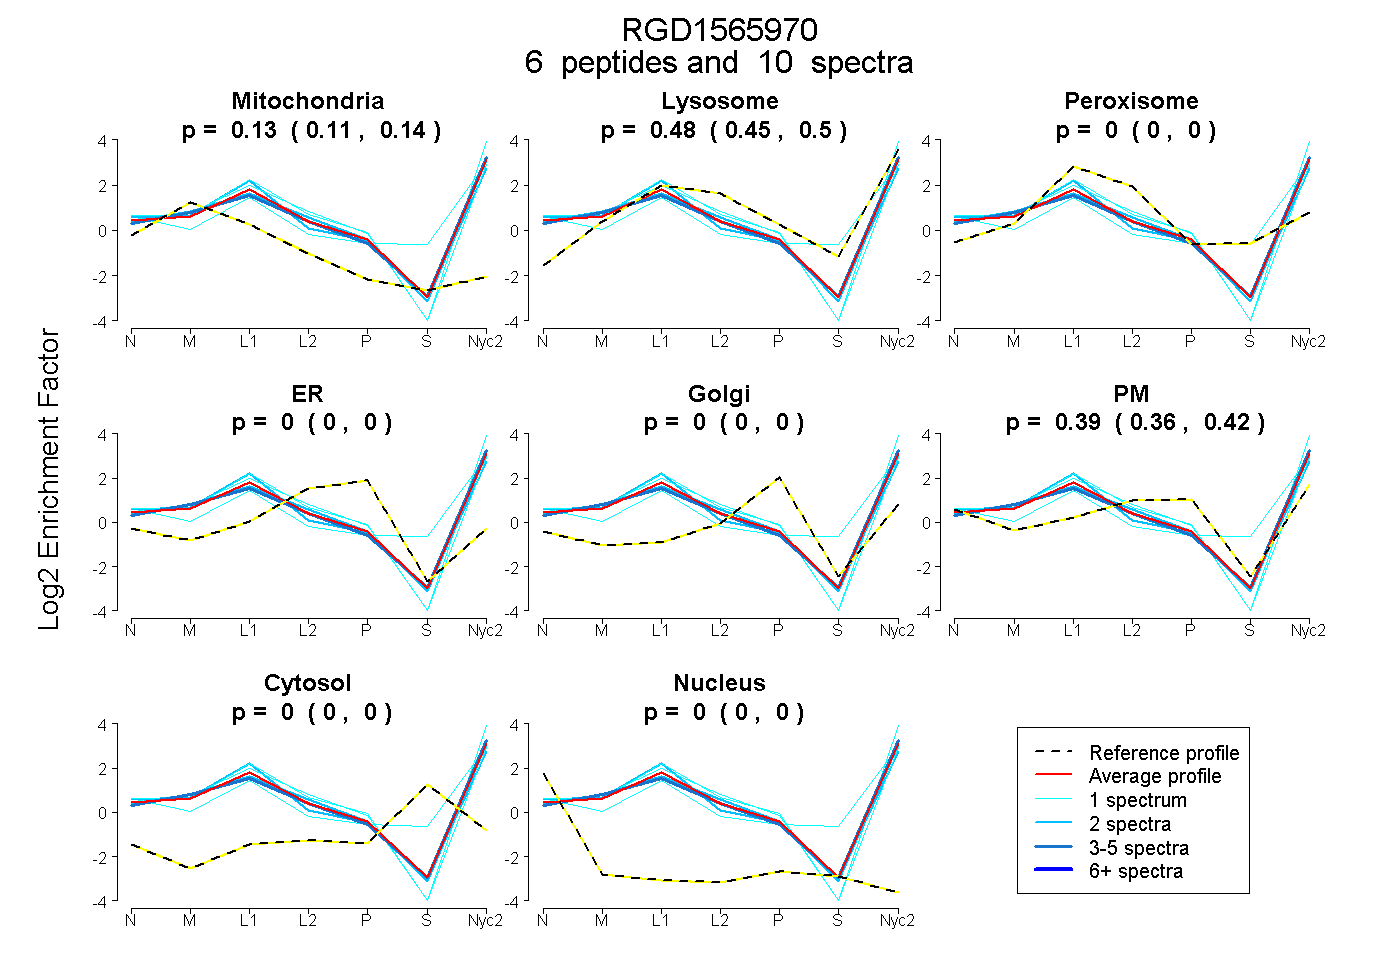
| Plot | Mito | Lyso | Perox | ER | Golgi | PM | Cytosol | Nucleus | |||||
| Expt A |
6 peptides |
10 spectra |
|
0.126 0.110 | 0.141 |
0.480 0.447 | 0.504 |
0.000 0.000 | 0.000 |
0.000 0.000 | 0.000 |
0.000 0.000 | 0.000 |
0.394 0.365 | 0.422 |
0.000 0.000 | 0.000 |
0.000 0.000 | 0.000 |
||
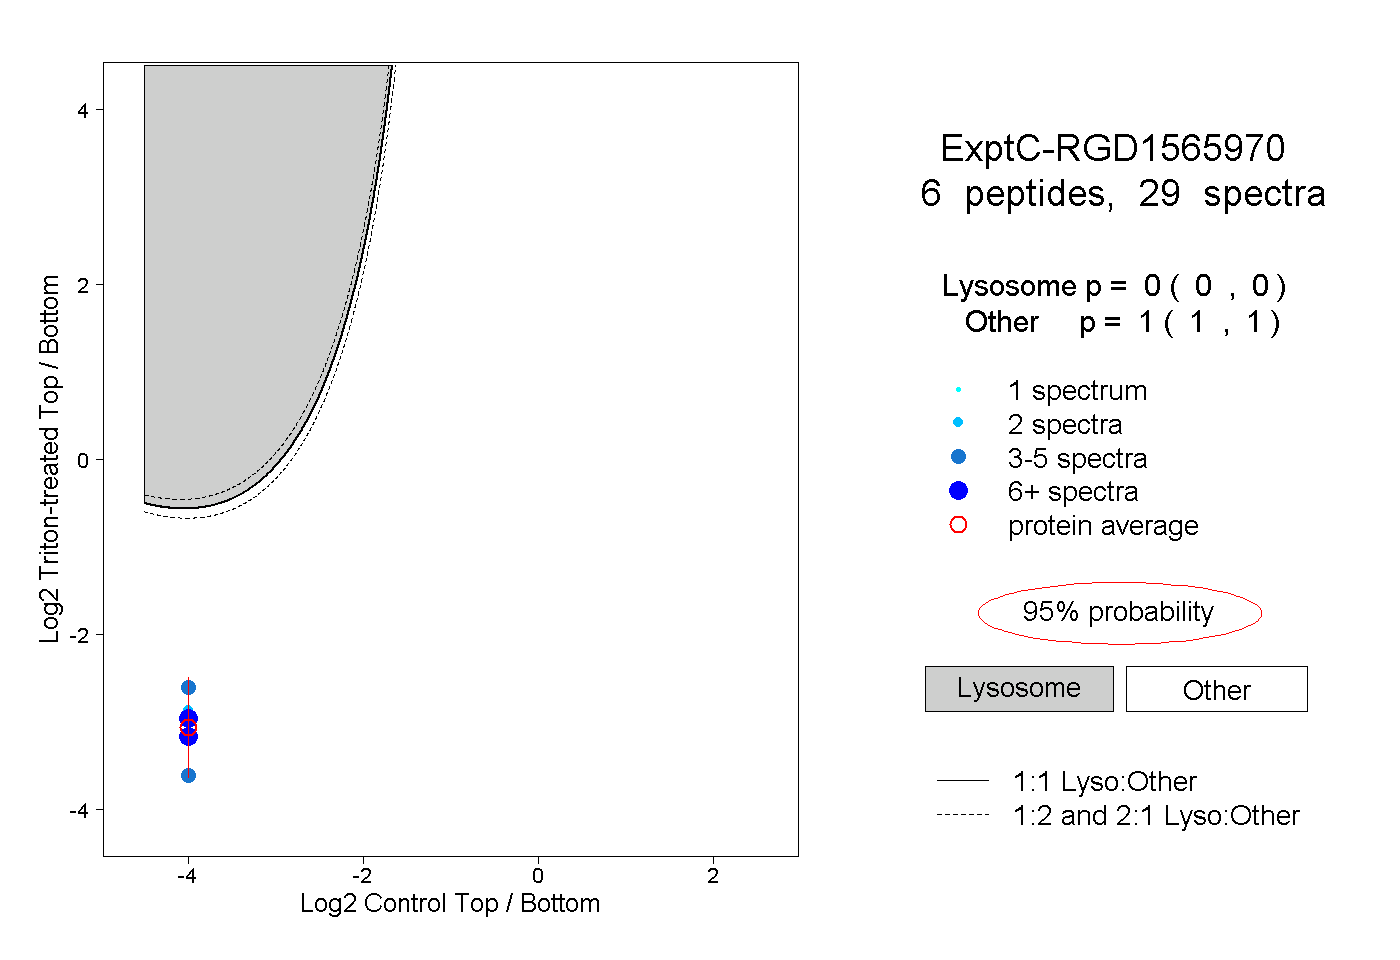
| Plot | Lyso | Other | |||||||||||
| Expt C |
6 peptides |
29 spectra |
|
0.000 0.000 | 0.000 |
1.000 1.000 | 1.000 |