 7
7peptides
spectra
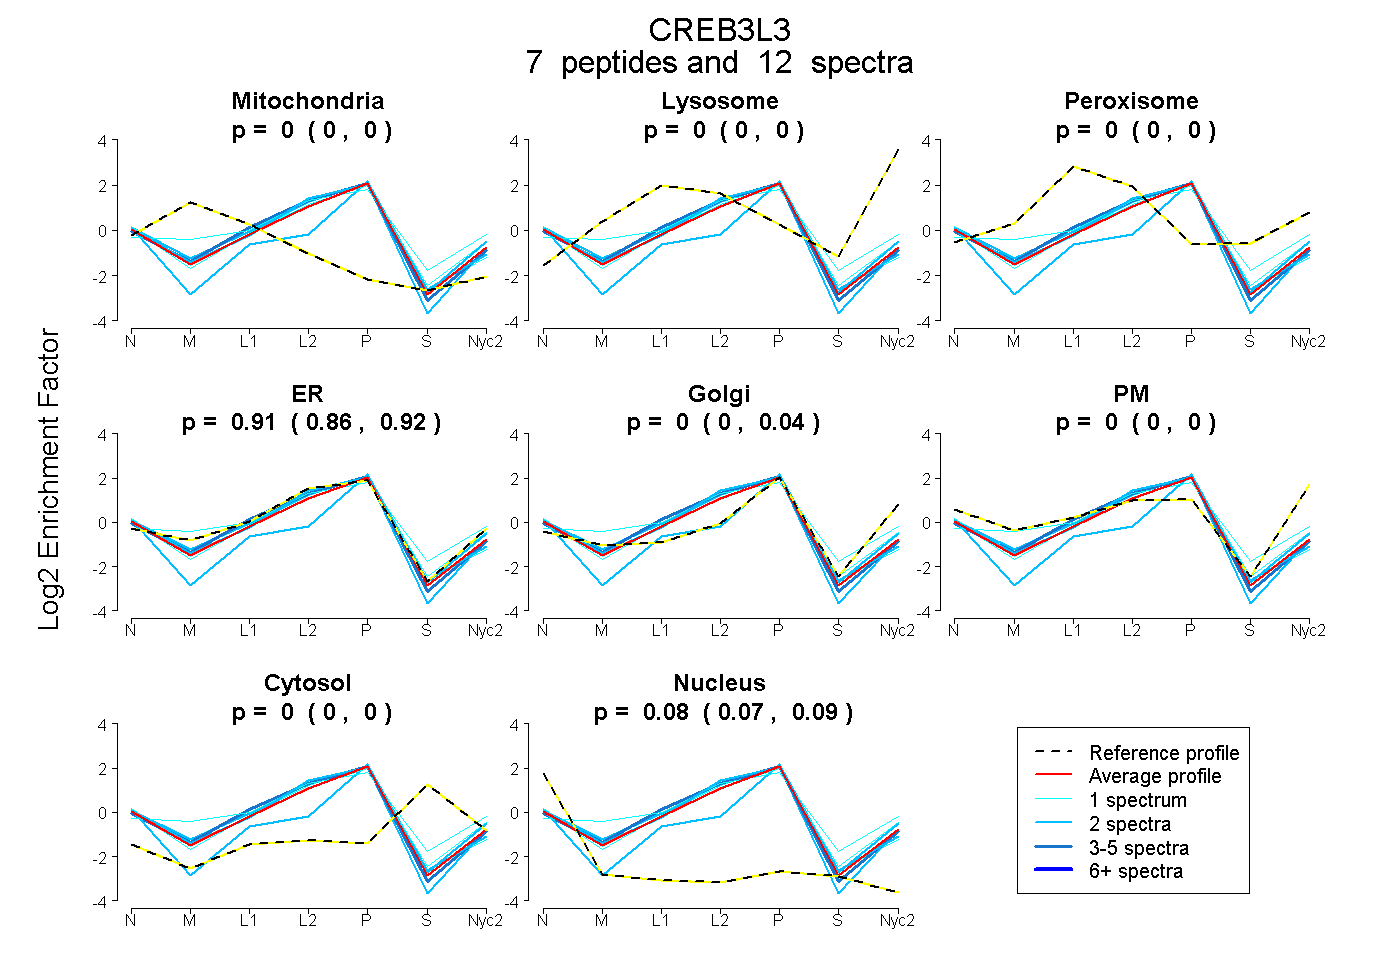
0.000 | 0.000
0.000 | 0.000
0.000 | 0.000
0.863 | 0.923
0.000 | 0.044
0.000 | 0.000
0.000 | 0.000
0.073 | 0.092
| Plot | Mito | Lyso | Perox | ER | Golgi | PM | Cytosol | Nucleus | |||||
| Expt A |
7 peptides |
12 spectra |
|
0.000 0.000 | 0.000 |
0.000 0.000 | 0.000 |
0.000 0.000 | 0.000 |
0.913 0.863 | 0.923 |
0.004 0.000 | 0.044 |
0.000 0.000 | 0.000 |
0.000 0.000 | 0.000 |
0.084 0.073 | 0.092 |
| 1 spectrum, VAPDVTPGPEVPGPHK | 0.000 | 0.000 | 0.105 | 0.728 | 0.110 | 0.000 | 0.057 | 0.000 | ||
| 1 spectrum, QNLSLLEQLK | 0.000 | 0.000 | 0.000 | 0.844 | 0.089 | 0.000 | 0.002 | 0.065 | ||
| 3 spectra, MSACTAQNQELQR | 0.000 | 0.000 | 0.000 | 0.944 | 0.000 | 0.000 | 0.000 | 0.056 | ||
| 2 spectra, VDSPGDFIPVR | 0.000 | 0.000 | 0.000 | 0.947 | 0.005 | 0.000 | 0.000 | 0.049 | ||
| 2 spectra, EYIDGLENR | 0.000 | 0.000 | 0.000 | 0.938 | 0.000 | 0.000 | 0.000 | 0.062 | ||
| 1 spectrum, EGVTLPTQLPLTK | 0.000 | 0.000 | 0.000 | 0.902 | 0.000 | 0.000 | 0.000 | 0.098 | ||
| 2 spectra, NVDLAESWILTR | 0.000 | 0.000 | 0.000 | 0.431 | 0.371 | 0.000 | 0.000 | 0.198 |
| Plot | Lyso | Other | |||||||||||
| Expt C |
2 peptides |
7 spectra |
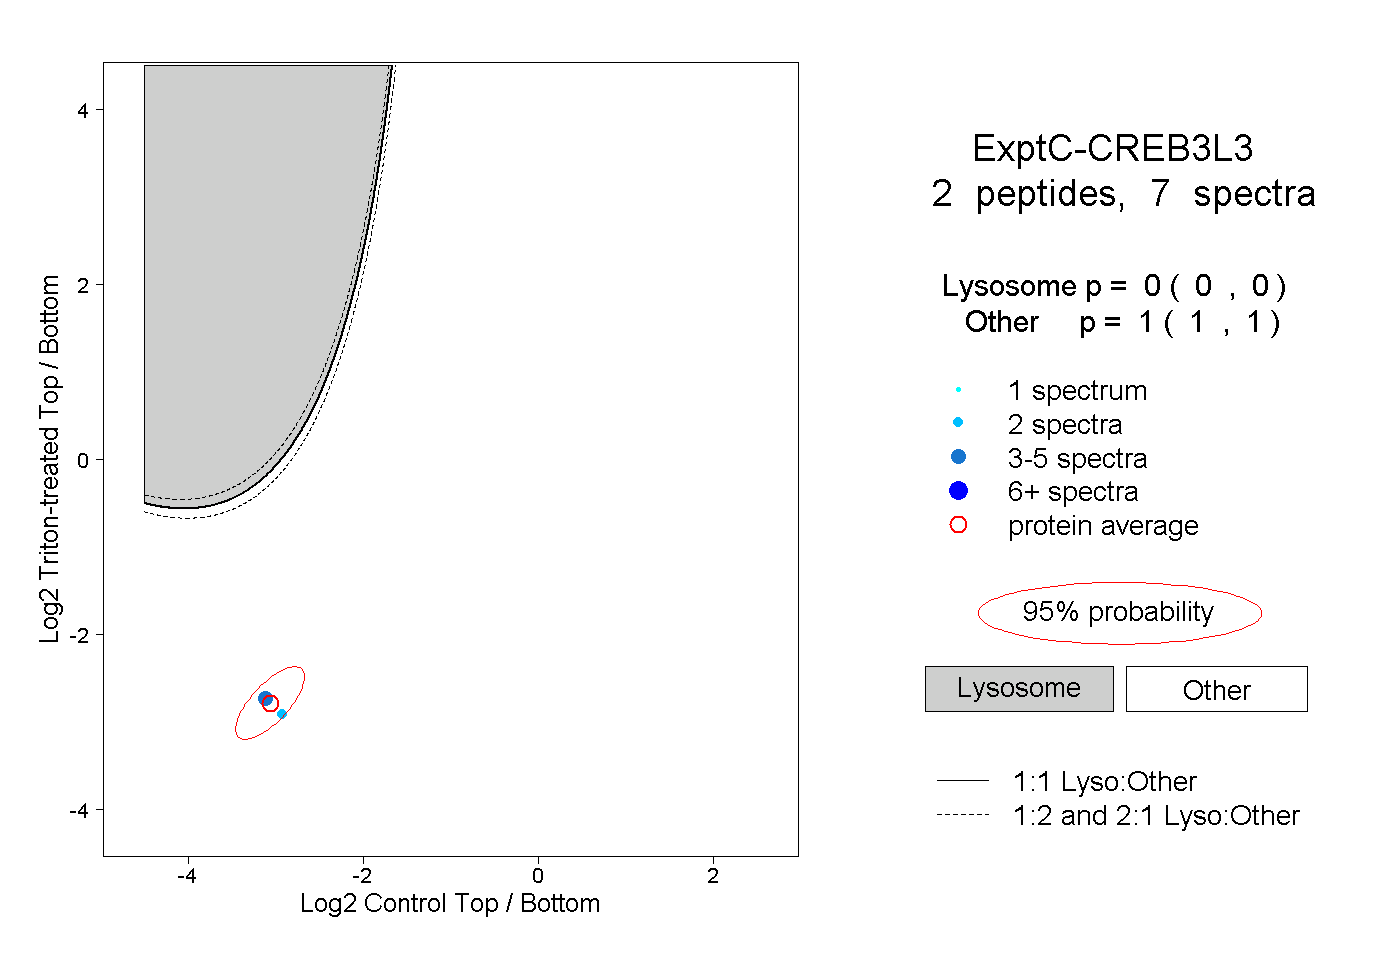 |
0.000 0.000 | 0.000 |
1.000 1.000 | 1.000 |