TARS2
[ENSRNOP00000044548]
Main page
| | | Plot |
Mito |
Lyso |
|
Perox |
ER |
Golgi |
PM |
Cytosol |
Nucleus |
|
| Expt A |
 20
20
peptides |
43
spectra |
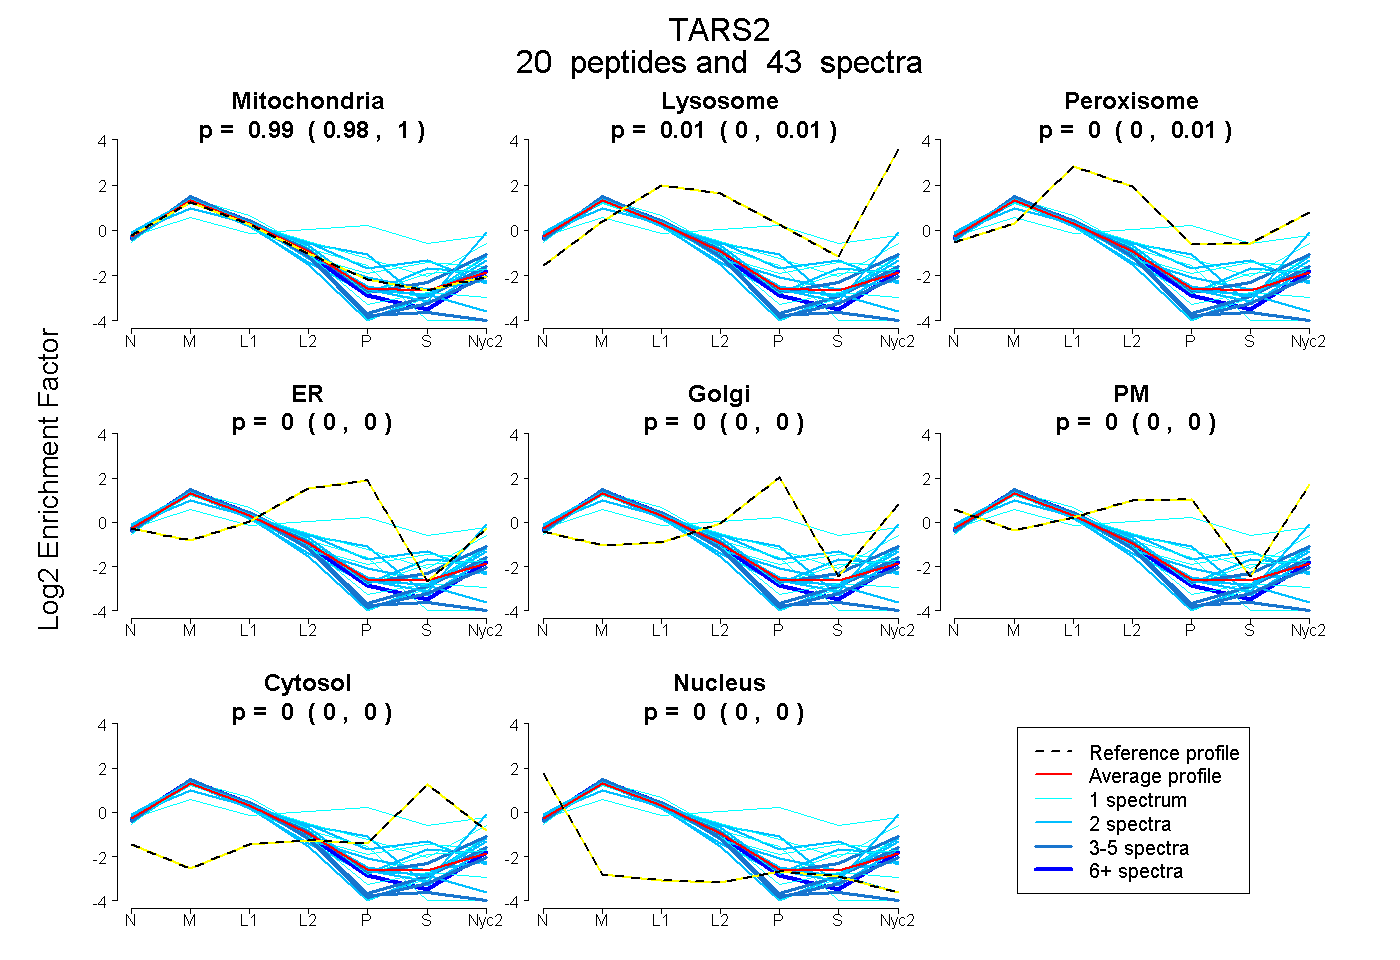 |
0.992
0.984 | 0.999 |
0.005
0.000 | 0.014 |
|
0.002
0.000 | 0.009 |
0.000
0.000 | 0.000 |
0.000
0.000 | 0.000 |
0.000
0.000 | 0.000 |
0.000
0.000 | 0.000 |
0.000
0.000 | 0.000 |
|
| | | Plot |
Mito |
|
Lyso or Perox |
|
ER |
Golgi |
PM |
Cytosol |
Nucleus |
|
| Expt B |
8
peptides |
13
spectra |
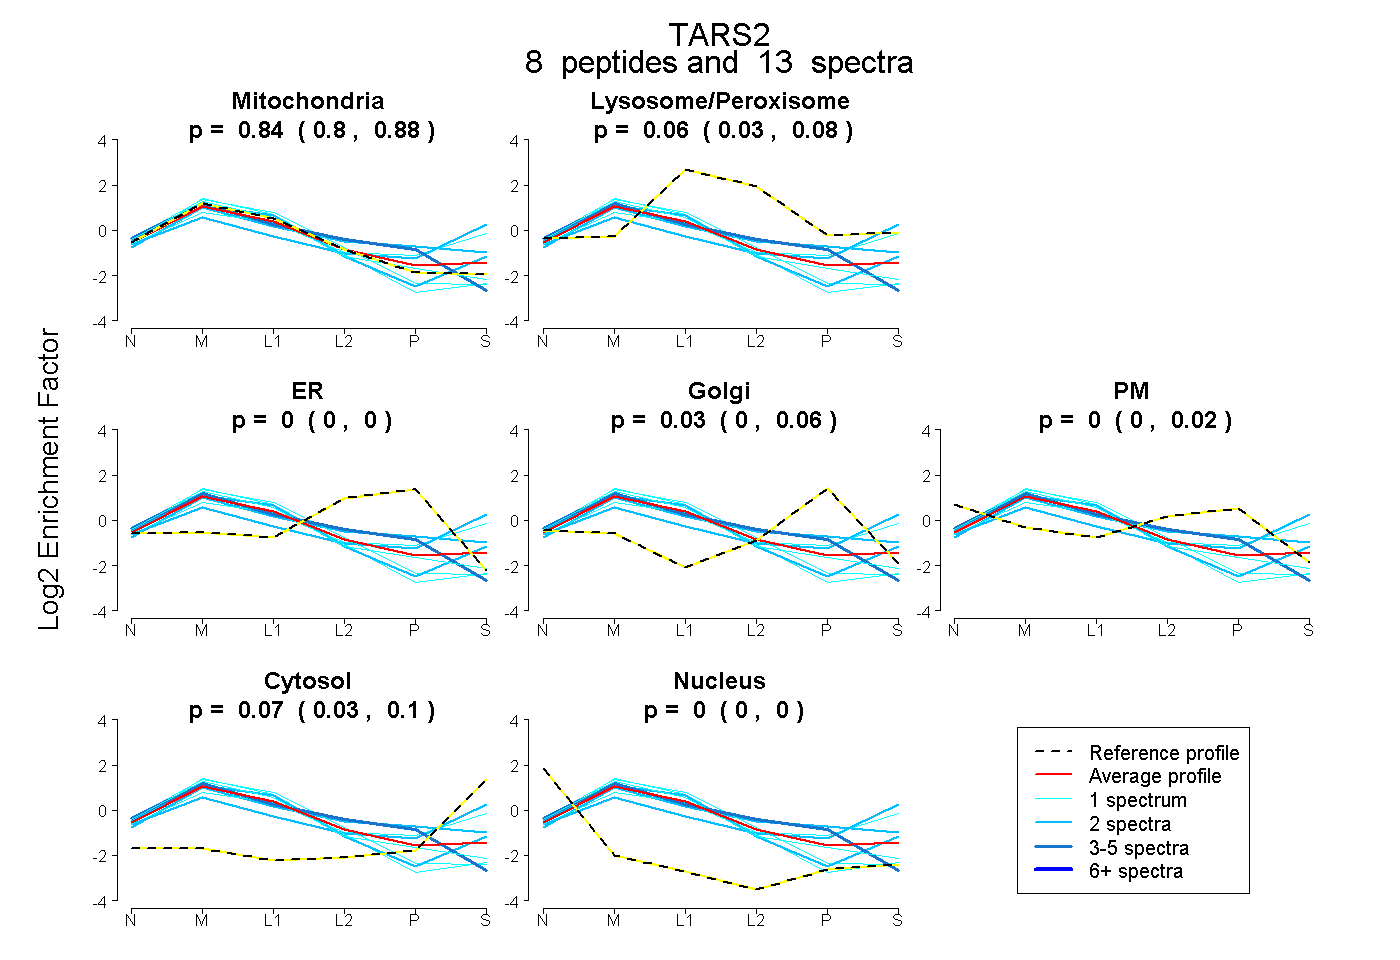 |
0.843
0.797 | 0.883 |
|
0.056
0.026 | 0.078 |
|
0.000
0.000 | 0.000 |
0.031
0.000 | 0.064 |
0.000
0.000 | 0.016 |
0.070
0.032 | 0.099 |
0.000
0.000 | 0.000 |
|
| | | Plot |
|
Lyso |
|
|
|
|
|
|
|
Other |
| Expt C |
26
peptides |
119
spectra |
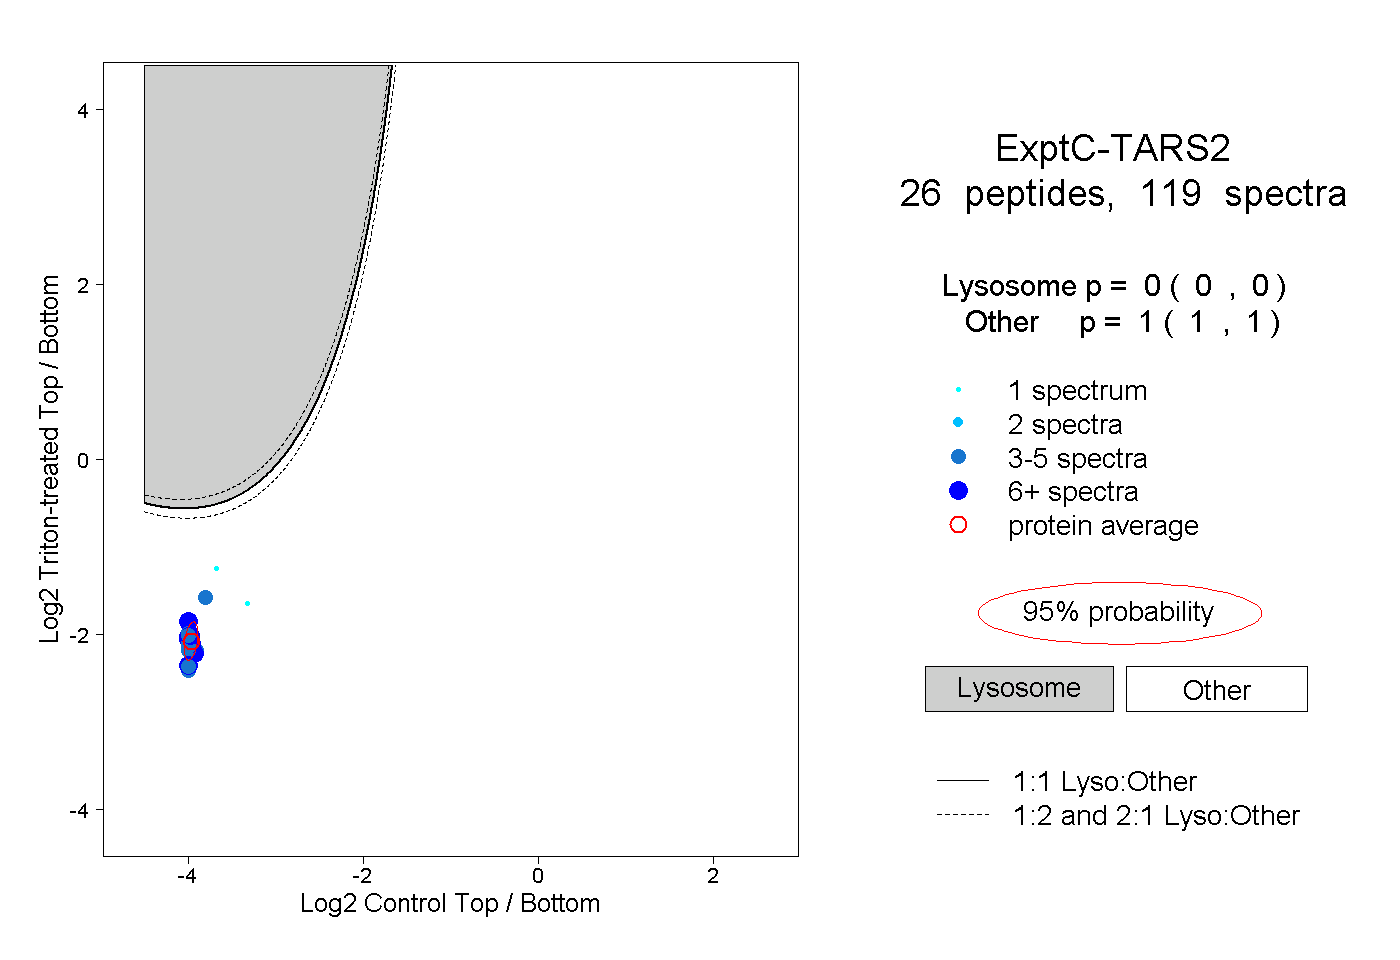 |
|
0.000
0.000 | 0.000 |
|
|
|
|
|
|
|
1.000
1.000 | 1.000 |
| | | Plot |
|
Lyso |
|
|
|
|
|
|
|
Other |
| Expt D |
10
peptides |
18
spectra |
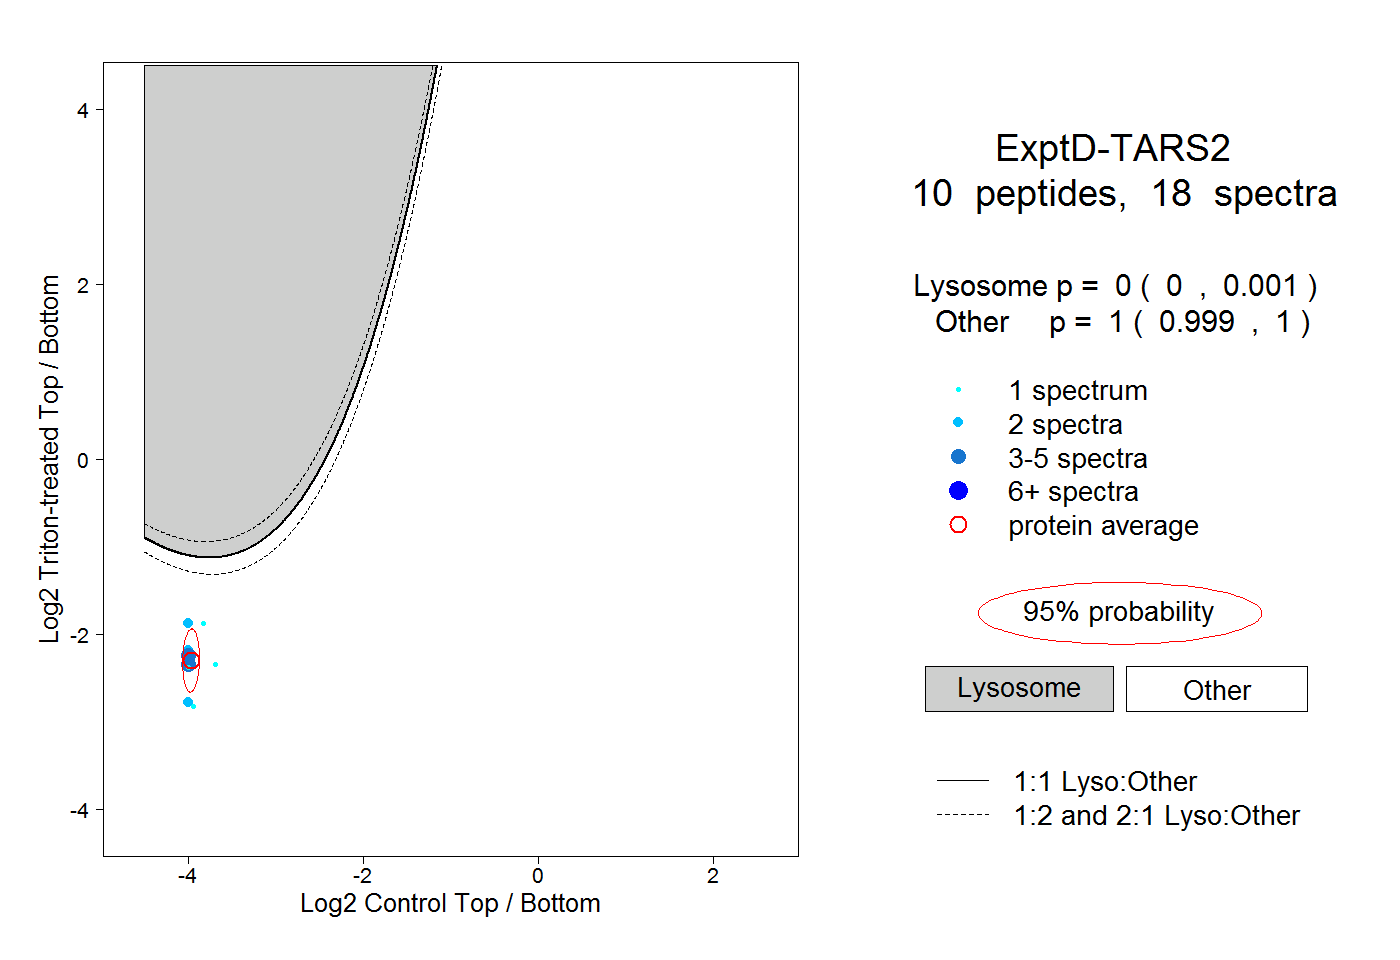 |
|
0.000
0.000 | 0.001 |
|
|
|
|
|
|
|
1.000
0.999 | 1.000 |
| 1 spectrum, GCLDFLR |
|
0.004 |
|
|
|
|
|
|
|
0.996 |
| 2 spectra, EEAELR |
|
0.003 |
|
|
|
|
|
|
|
0.997 |
| 1 spectrum, ISLPEGQK |
|
0.000 |
|
|
|
|
|
|
|
1.000 |
| 3 spectra, FLTFDSPEGK |
|
0.000 |
|
|
|
|
|
|
|
1.000 |
| 4 spectra, TEQEDYAR |
|
0.000 |
|
|
|
|
|
|
|
1.000 |
| 1 spectrum, LHVIEEK |
|
0.000 |
|
|
|
|
|
|
|
1.000 |
| 1 spectrum, VSGISFPK |
|
0.000 |
|
|
|
|
|
|
|
1.000 |
| 1 spectrum, EQSQMSVNVR |
|
0.000 |
|
|
|
|
|
|
|
1.000 |
| 2 spectra, SSEAPETLQR |
|
0.000 |
|
|
|
|
|
|
|
1.000 |
| 2 spectra, LLELQDAR |
|
0.000 |
|
|
|
|
|
|
|
1.000 |