 6
6peptides
spectra
0.000 | 0.000
0.000 | 0.000
0.000 | 0.000
0.000 | 0.000
0.070 | 0.139
0.771 | 0.813
0.062 | 0.120
0.000 | 0.010
7peptides
spectra

0.000 | 0.000
1.000 | 1.000
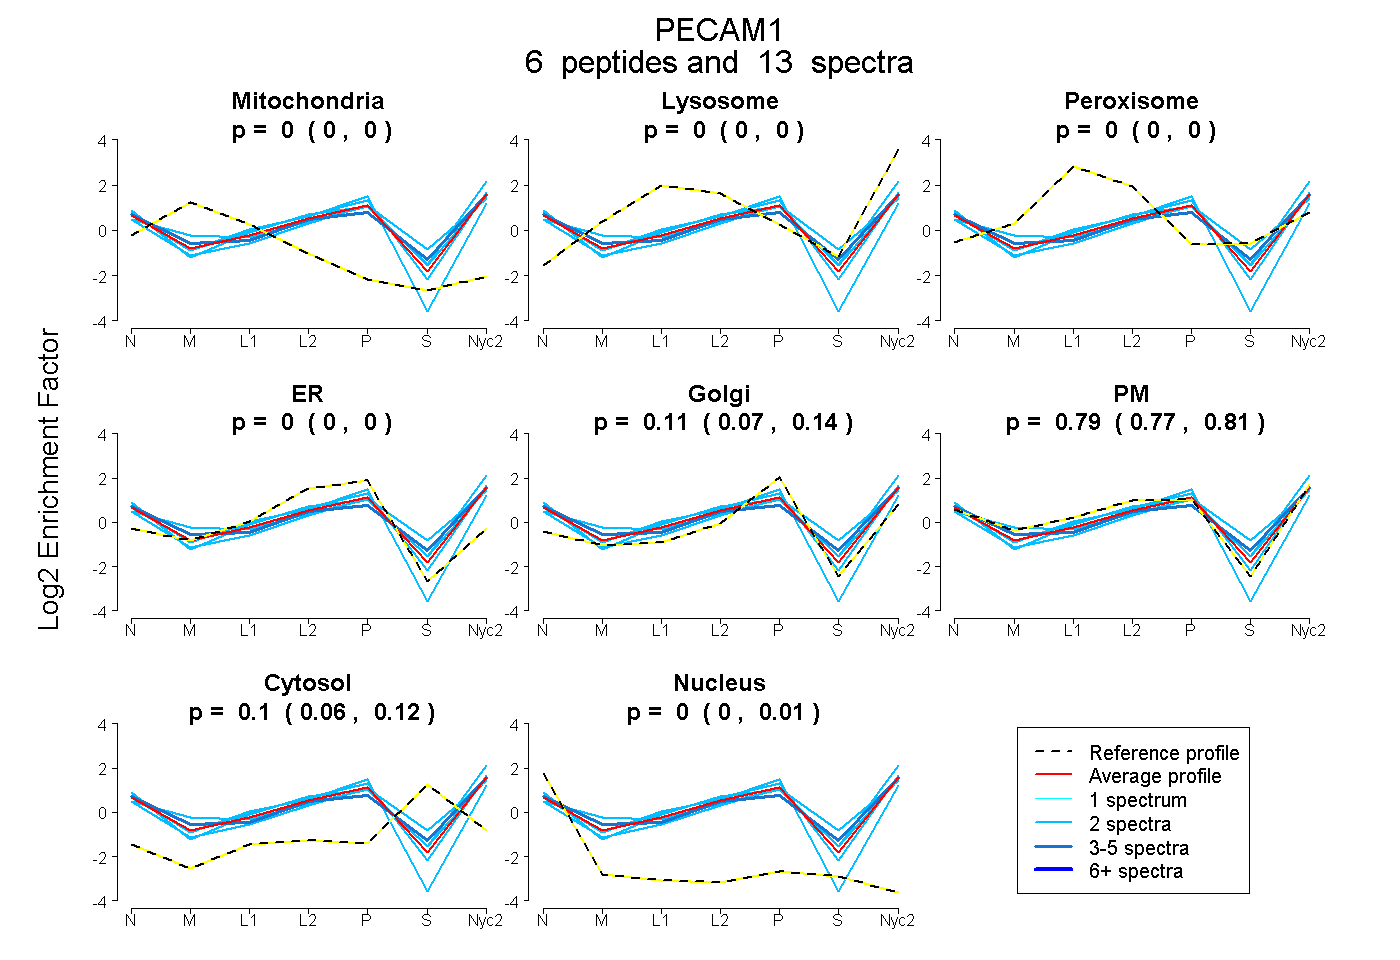
| Plot | Mito | Lyso | Perox | ER | Golgi | PM | Cytosol | Nucleus | |||||
| Expt A |
6 peptides |
13 spectra |
|
0.000 0.000 | 0.000 |
0.000 0.000 | 0.000 |
0.000 0.000 | 0.000 |
0.000 0.000 | 0.000 |
0.107 0.070 | 0.139 |
0.793 0.771 | 0.813 |
0.099 0.062 | 0.120 |
0.000 0.000 | 0.010 |
||
| Plot | Lyso | Other | |||||||||||
| Expt C |
7 peptides |
17 spectra |
|
0.000 0.000 | 0.000 |
1.000 1.000 | 1.000 |