 3
3peptides
spectra
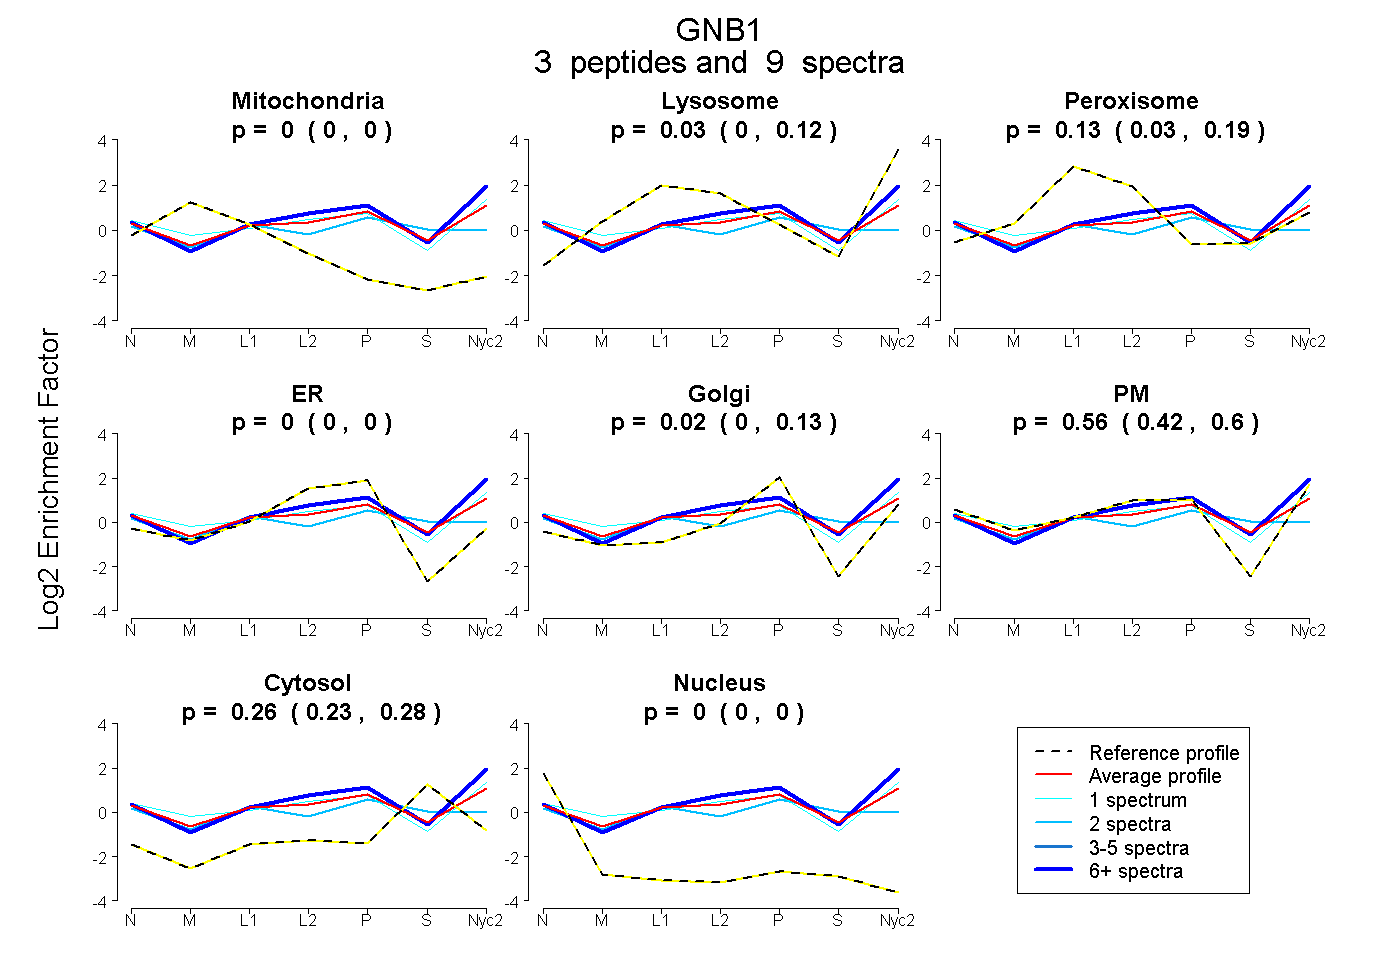
0.000 | 0.000
0.000 | 0.122
0.029 | 0.193
0.000 | 0.000
0.000 | 0.127
0.416 | 0.601
0.228 | 0.278
0.000 | 0.000
1peptide
spectrum
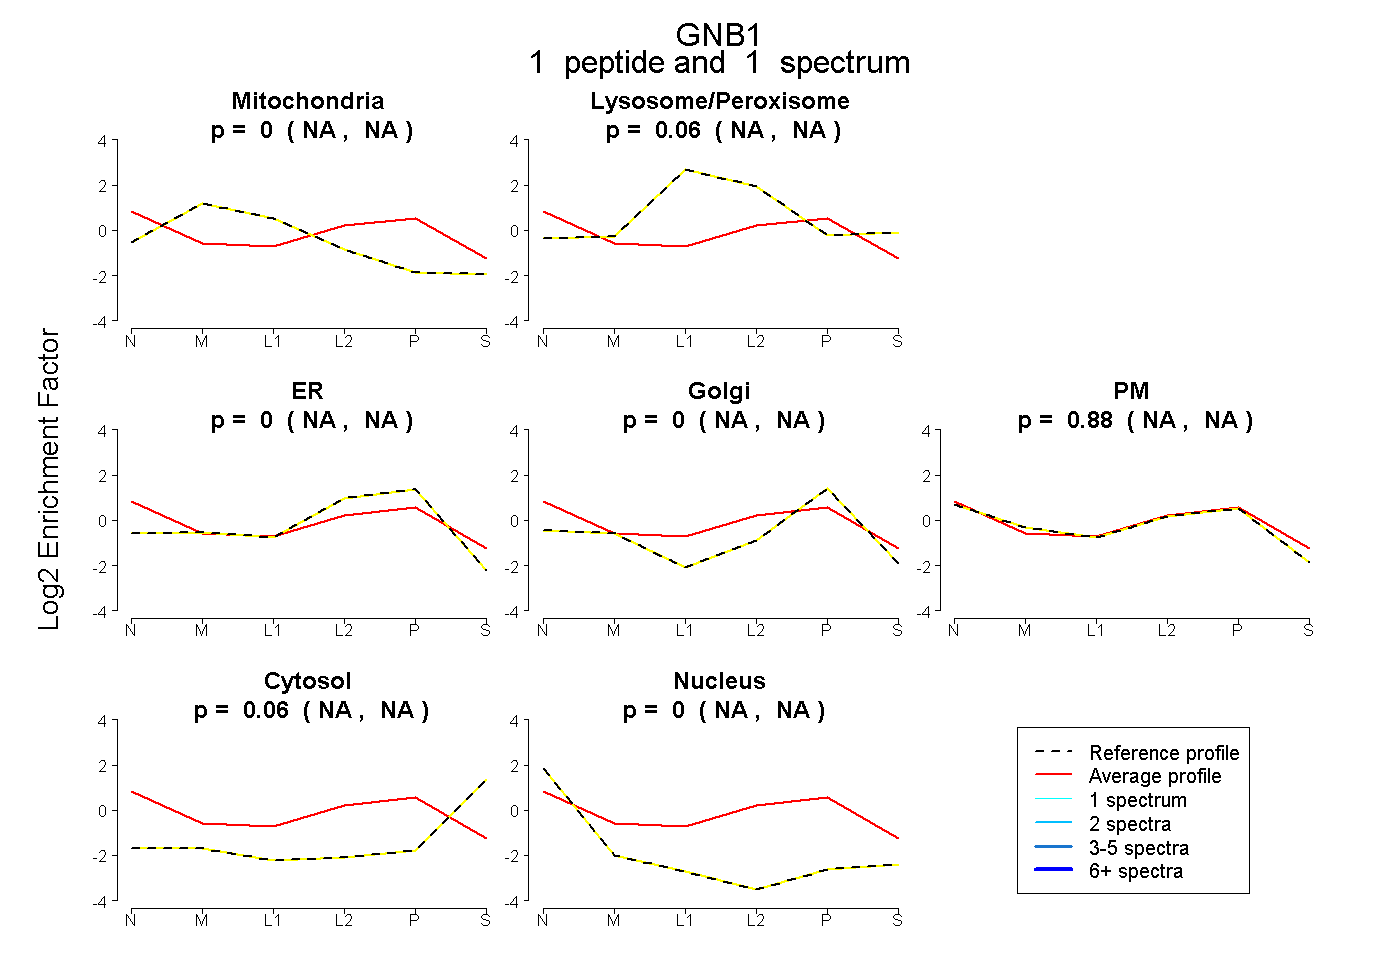
NA | NA
NA | NA
NA | NA
NA | NA
NA | NA
NA | NA
NA | NA
3peptides
spectra
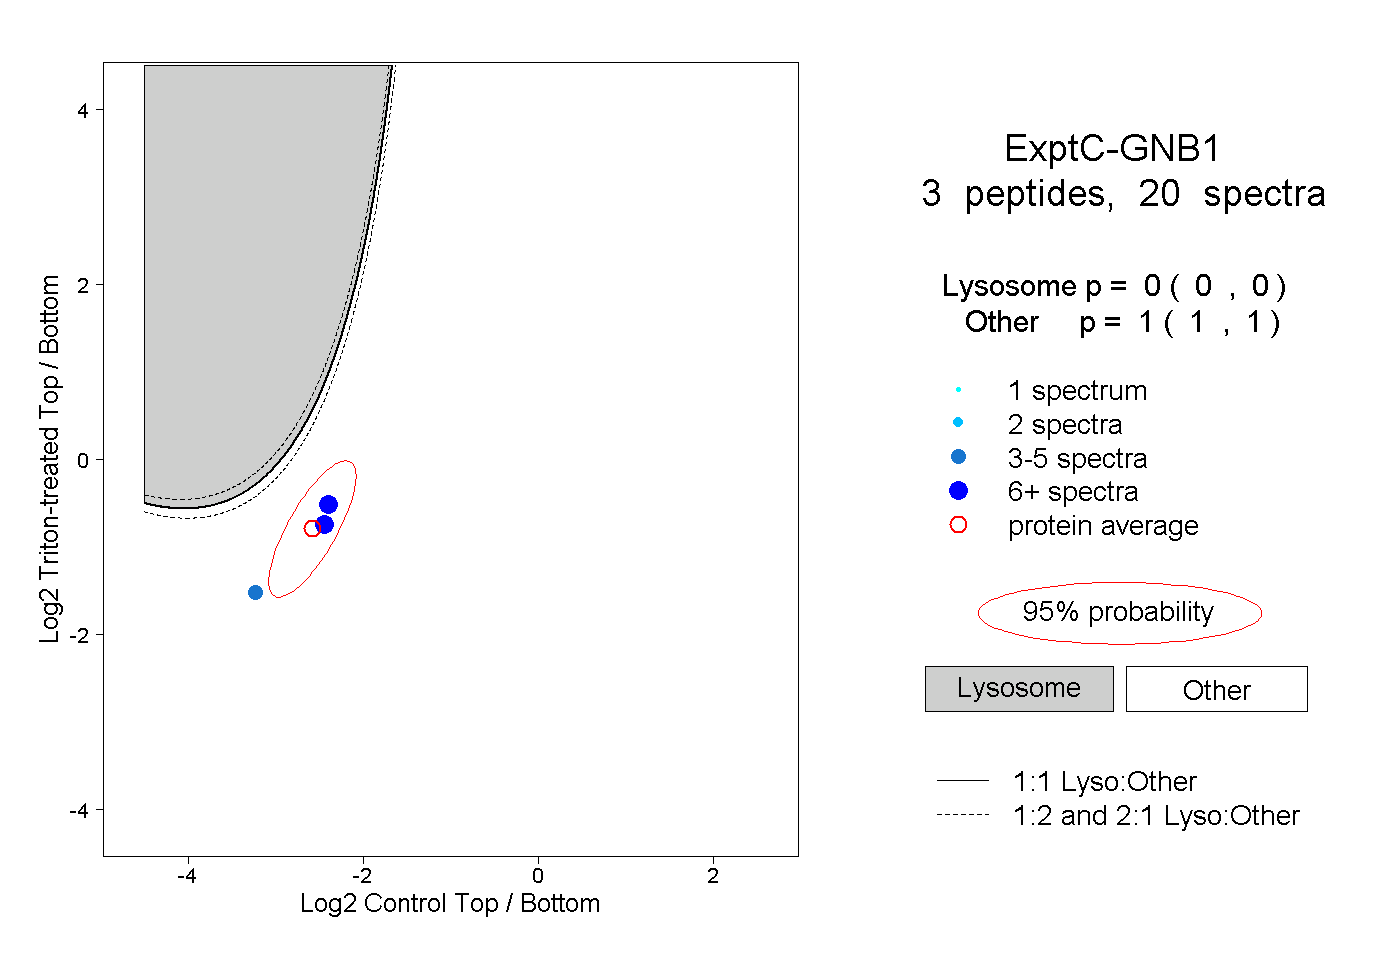
0.000 | 0.000
1.000 | 1.000
4peptides
spectra
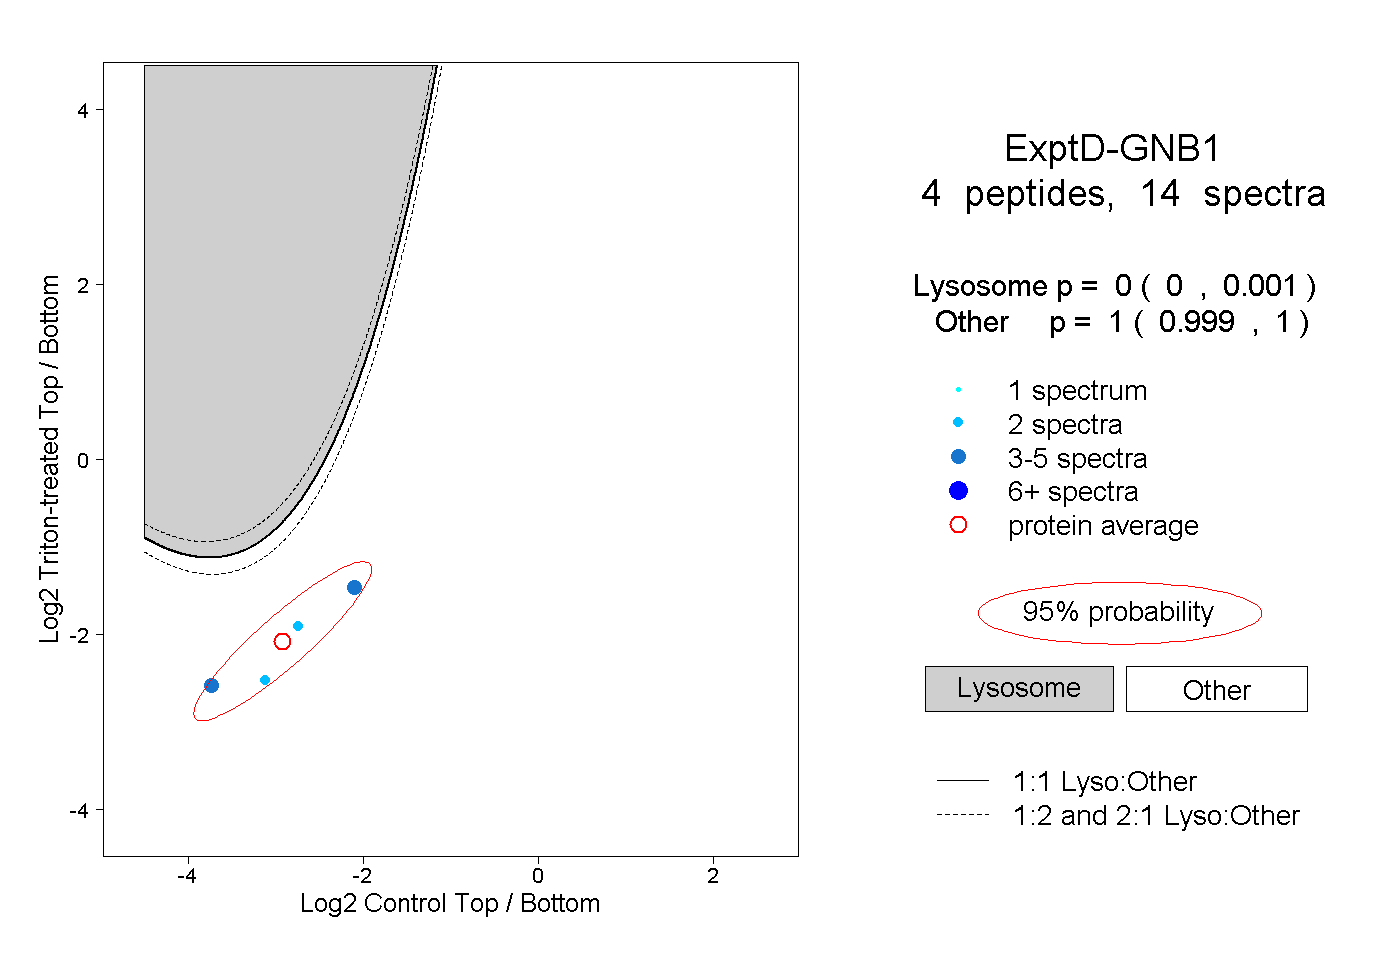
0.000 | 0.001
0.999 | 1.000