 1
1peptide
spectra
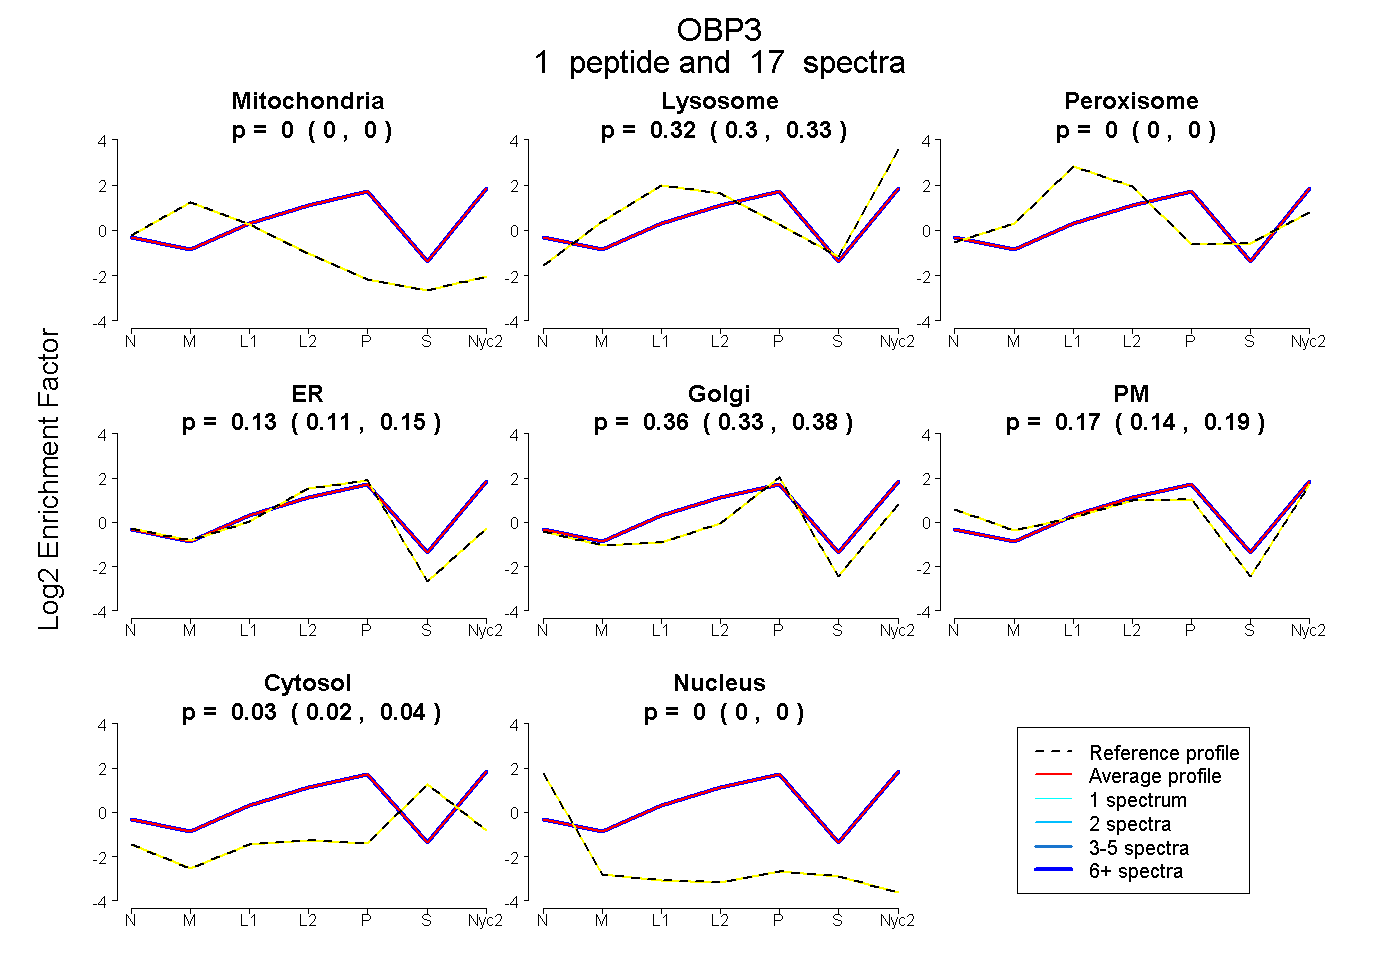
0.000 | 0.000
0.304 | 0.328
0.000 | 0.000
0.111 | 0.148
0.327 | 0.379
0.137 | 0.188
0.015 | 0.042
0.000 | 0.000
1peptide
spectra
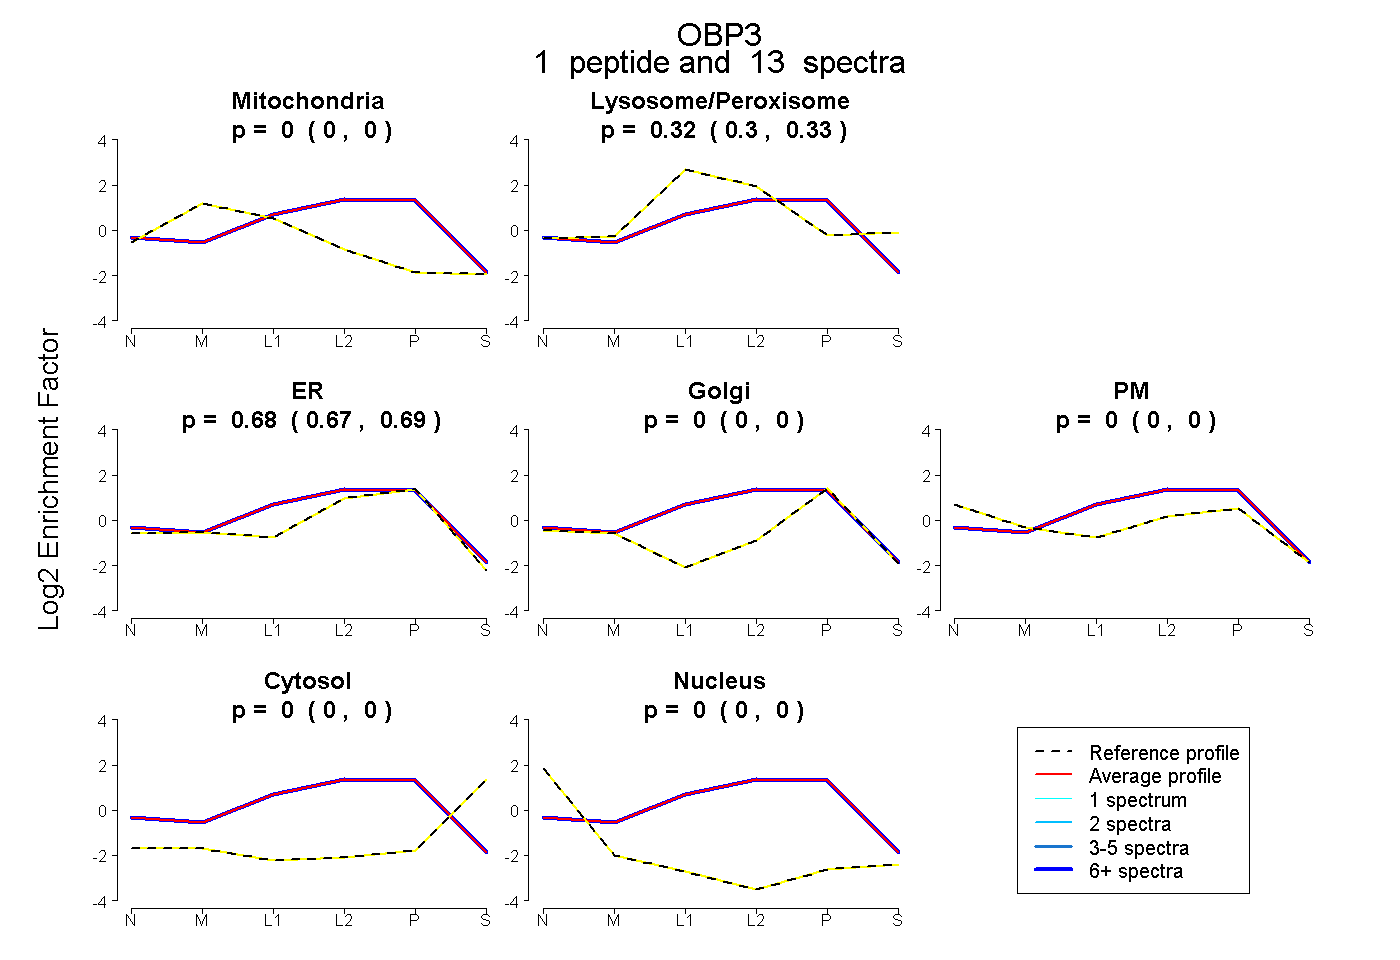
0.000 | 0.000
0.303 | 0.326
0.673 | 0.695
0.000 | 0.000
0.000 | 0.000
0.000 | 0.000
0.000 | 0.000
2peptides
spectra
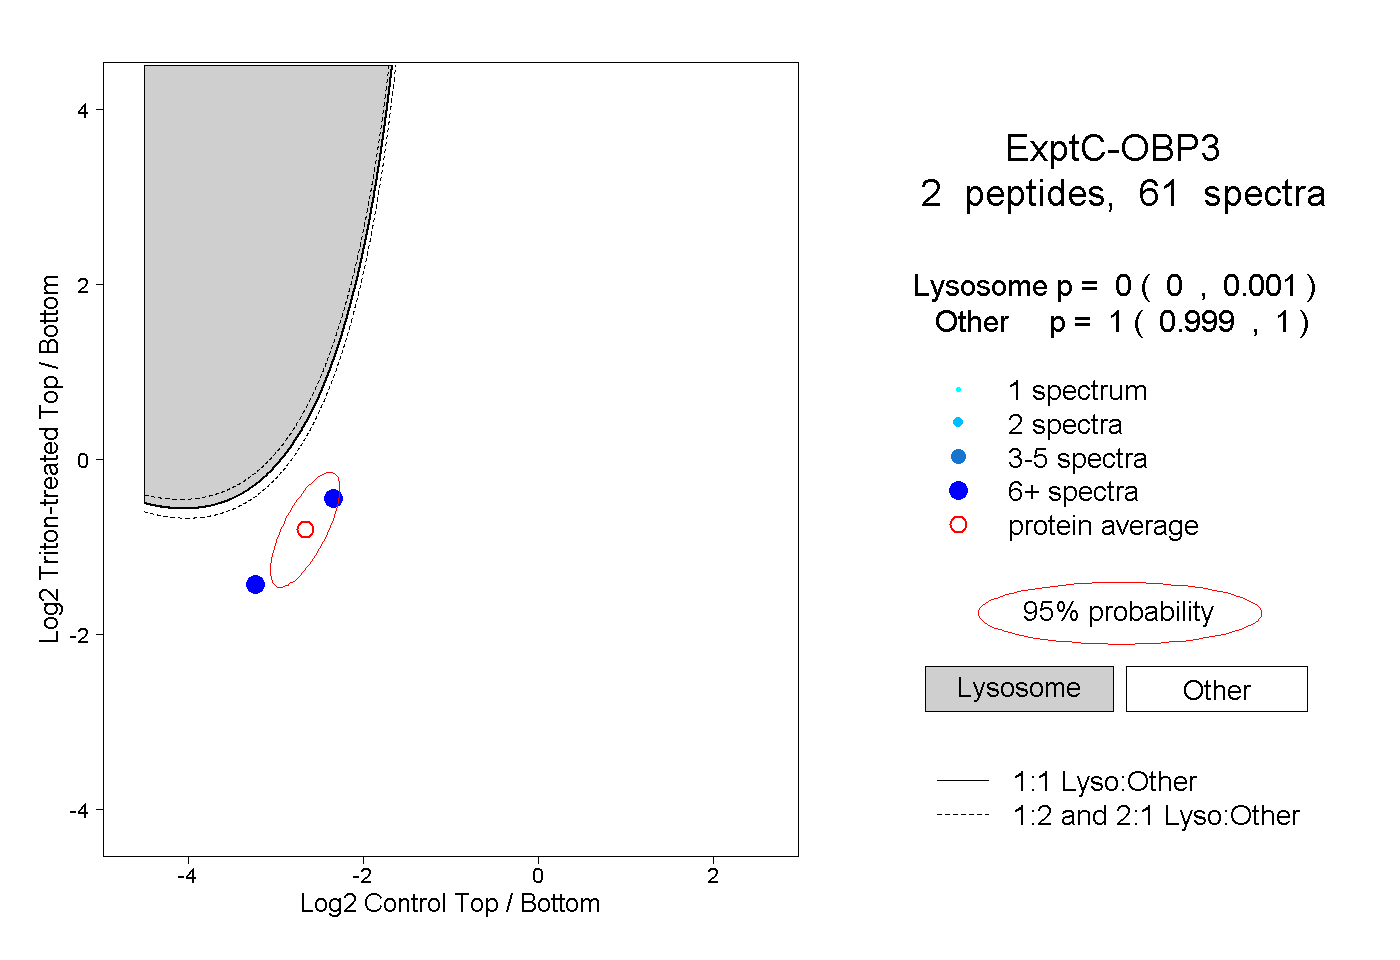
0.000 | 0.001
0.999 | 1.000
1peptide
spectra
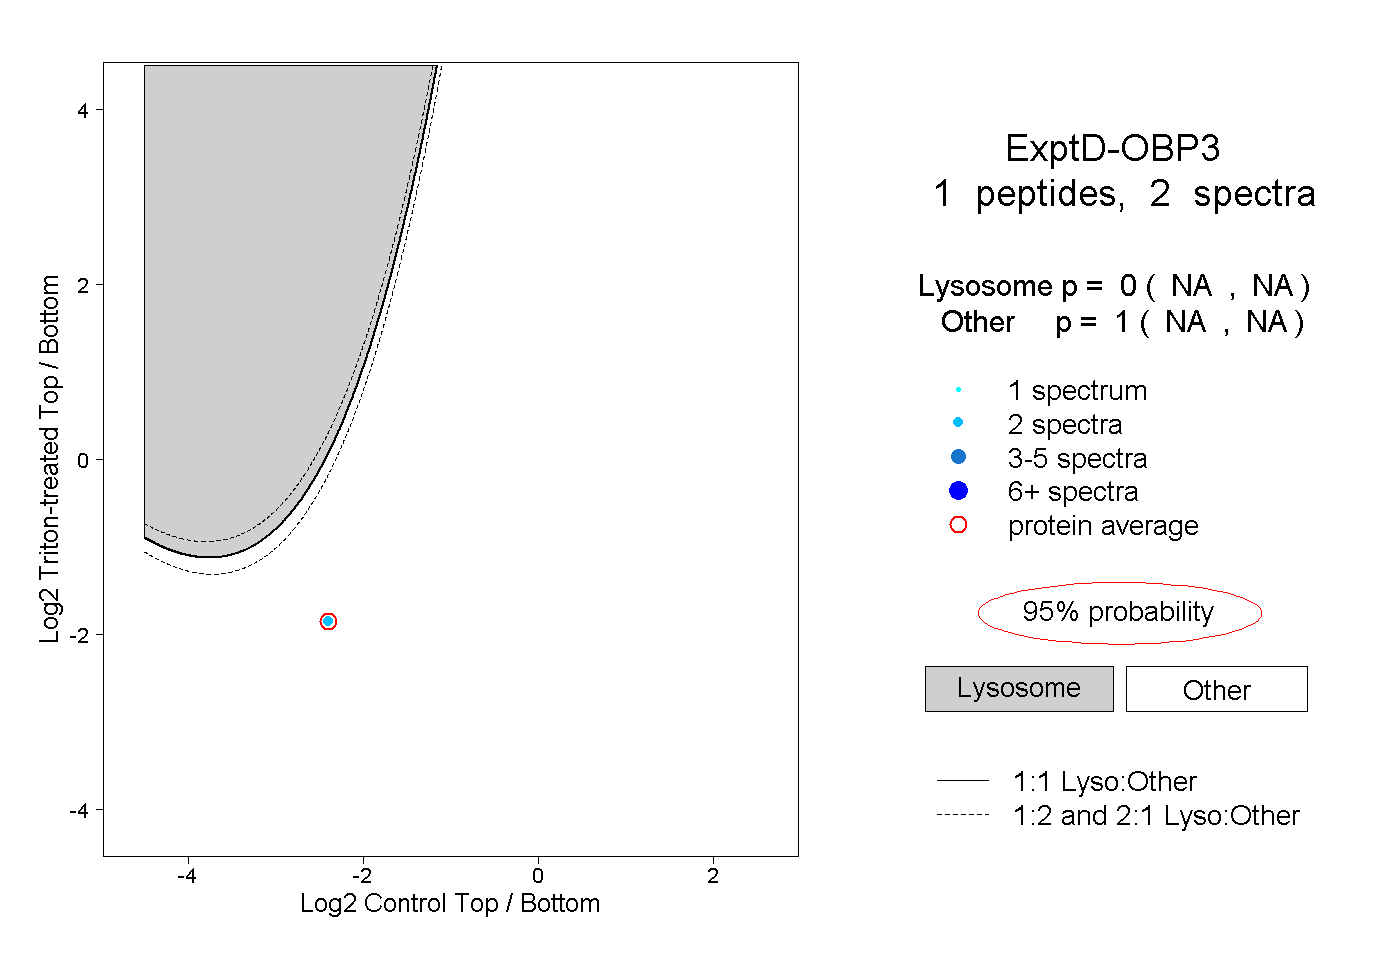
NA | NA
NA | NA