 6
6peptides
spectra
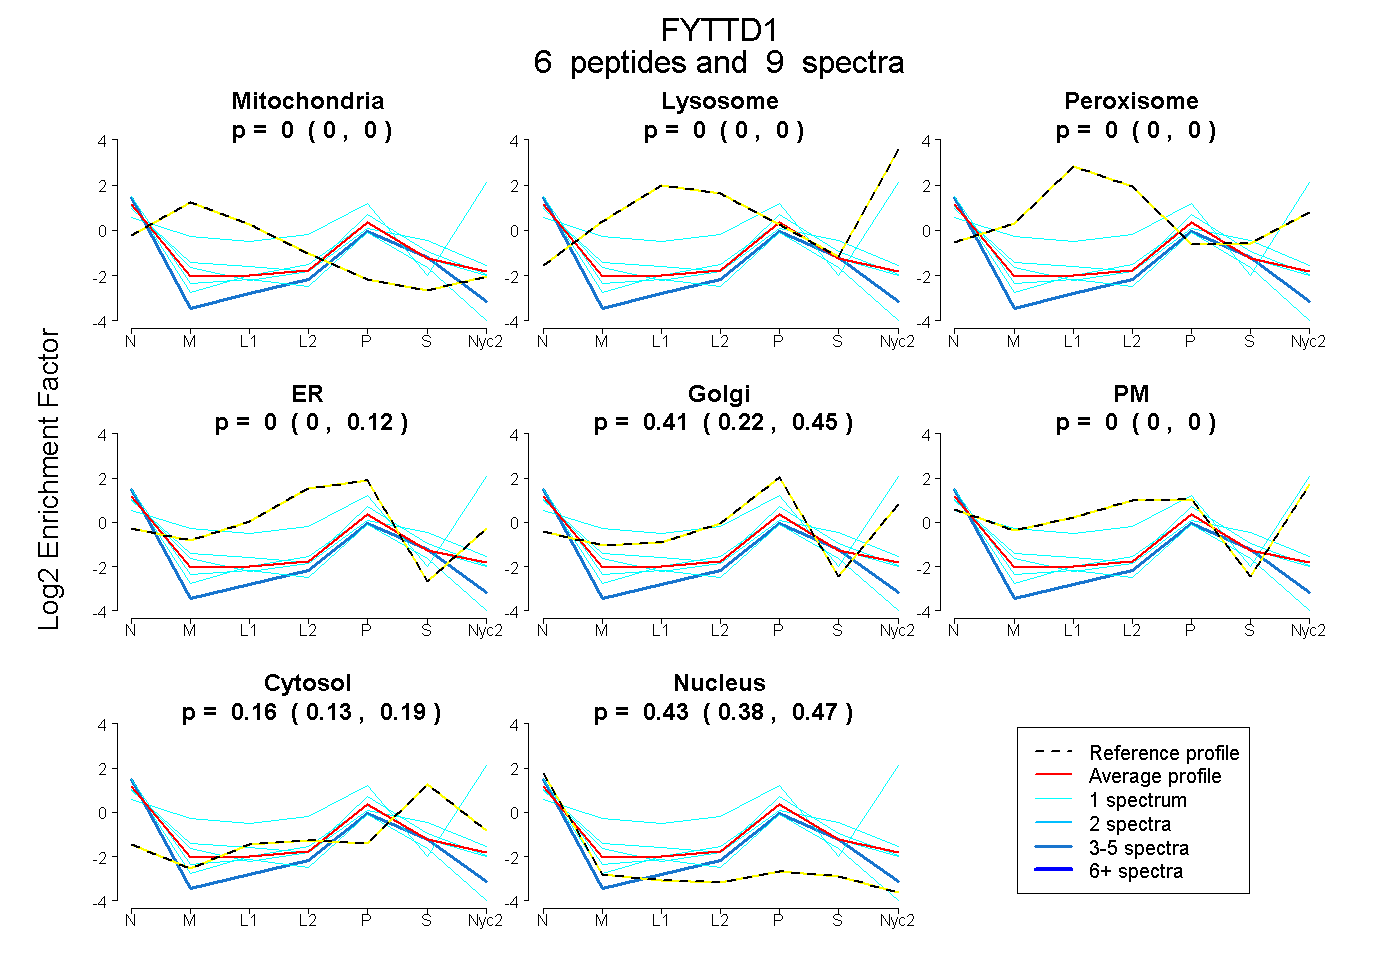
0.000 | 0.000
0.000 | 0.000
0.000 | 0.000
0.000 | 0.119
0.219 | 0.447
0.000 | 0.000
0.135 | 0.190
0.383 | 0.467
| Plot | Mito | Lyso | Perox | ER | Golgi | PM | Cytosol | Nucleus | |||||
| Expt A |
6 peptides |
9 spectra |
|
0.000 0.000 | 0.000 |
0.000 0.000 | 0.000 |
0.000 0.000 | 0.000 |
0.000 0.000 | 0.119 |
0.409 0.219 | 0.447 |
0.000 0.000 | 0.000 |
0.165 0.135 | 0.190 |
0.427 0.383 | 0.467 |
| 1 spectrum, SVEIR | 0.000 | 0.024 | 0.000 | 0.000 | 0.272 | 0.657 | 0.039 | 0.008 | ||
| 1 spectrum, YFPALK | 0.000 | 0.000 | 0.000 | 0.216 | 0.000 | 0.000 | 0.072 | 0.711 | ||
| 4 spectra, RPYGVITGLAAR | 0.000 | 0.000 | 0.000 | 0.024 | 0.151 | 0.000 | 0.190 | 0.635 | ||
| 1 spectrum, QATFLFR | 0.000 | 0.000 | 0.000 | 0.088 | 0.282 | 0.000 | 0.179 | 0.451 | ||
| 1 spectrum, LQQSGAR | 0.000 | 0.000 | 0.000 | 0.000 | 0.325 | 0.000 | 0.320 | 0.355 | ||
| 1 spectrum, AALPFSK | 0.000 | 0.000 | 0.000 | 0.075 | 0.366 | 0.000 | 0.196 | 0.363 |
| Plot | Lyso | Other | |||||||||||
| Expt C |
1 peptide |
6 spectra |
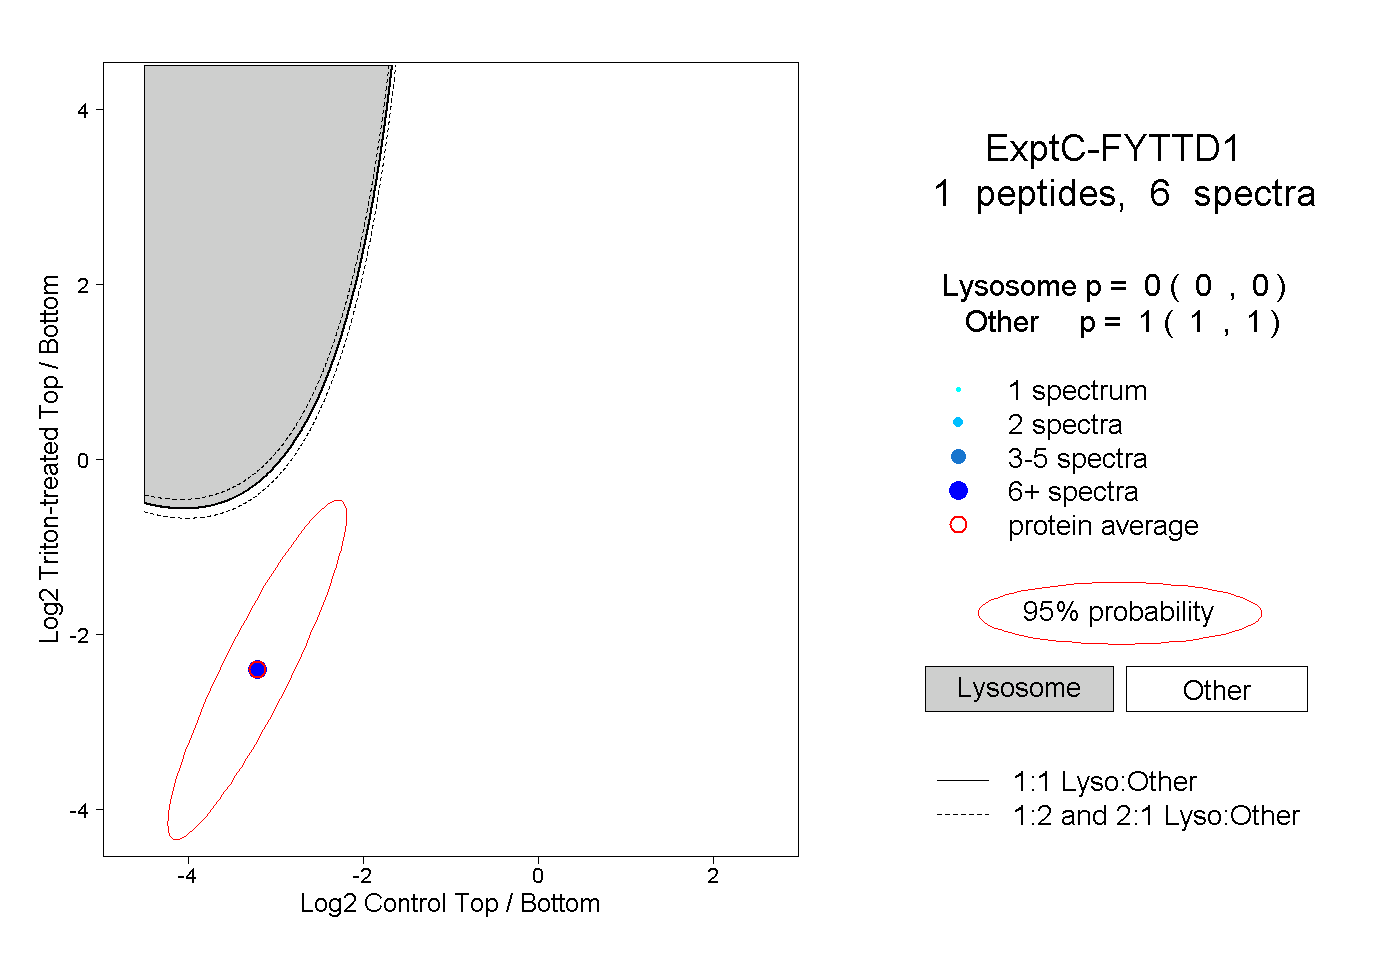 |
0.000 0.000 | 0.000 |
1.000 1.000 | 1.000 |