 3
3peptides
spectra
0.000 | 0.000
0.000 | 0.000
0.000 | 0.000
0.000 | 0.450
0.000 | 0.405
0.000 | 0.093
0.055 | 0.126
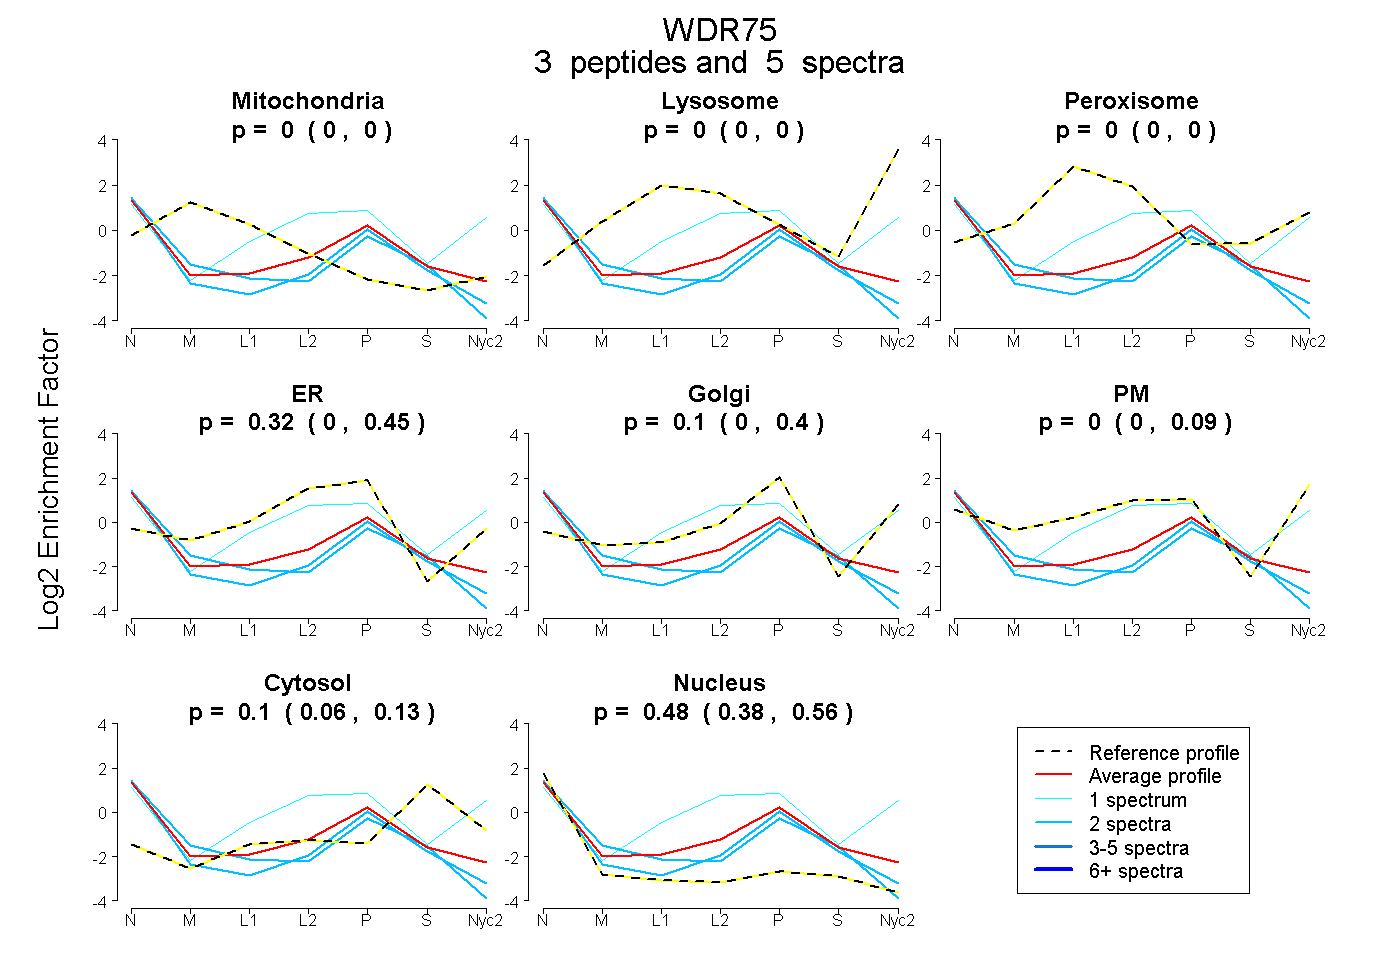
0.380 | 0.560
| Plot | Mito | Lyso | Perox | ER | Golgi | PM | Cytosol | Nucleus | |||||
| Expt A |
3 peptides |
5 spectra |
|
0.000 0.000 | 0.000 |
0.000 0.000 | 0.000 |
0.000 0.000 | 0.000 |
0.316 0.000 | 0.450 |
0.102 0.000 | 0.405 |
0.000 0.000 | 0.093 |
0.104 0.055 | 0.126 |
0.479 0.380 | 0.560 |
| 1 spectrum, ELTFVLDYINK | 0.000 | 0.000 | 0.000 | 0.175 | 0.000 | 0.562 | 0.173 | 0.090 | ||
| 2 spectra, HLCFGR | 0.000 | 0.000 | 0.000 | 0.151 | 0.134 | 0.000 | 0.055 | 0.660 | ||
| 2 spectra, VQWGVFVPR | 0.023 | 0.000 | 0.000 | 0.237 | 0.000 | 0.000 | 0.073 | 0.666 |