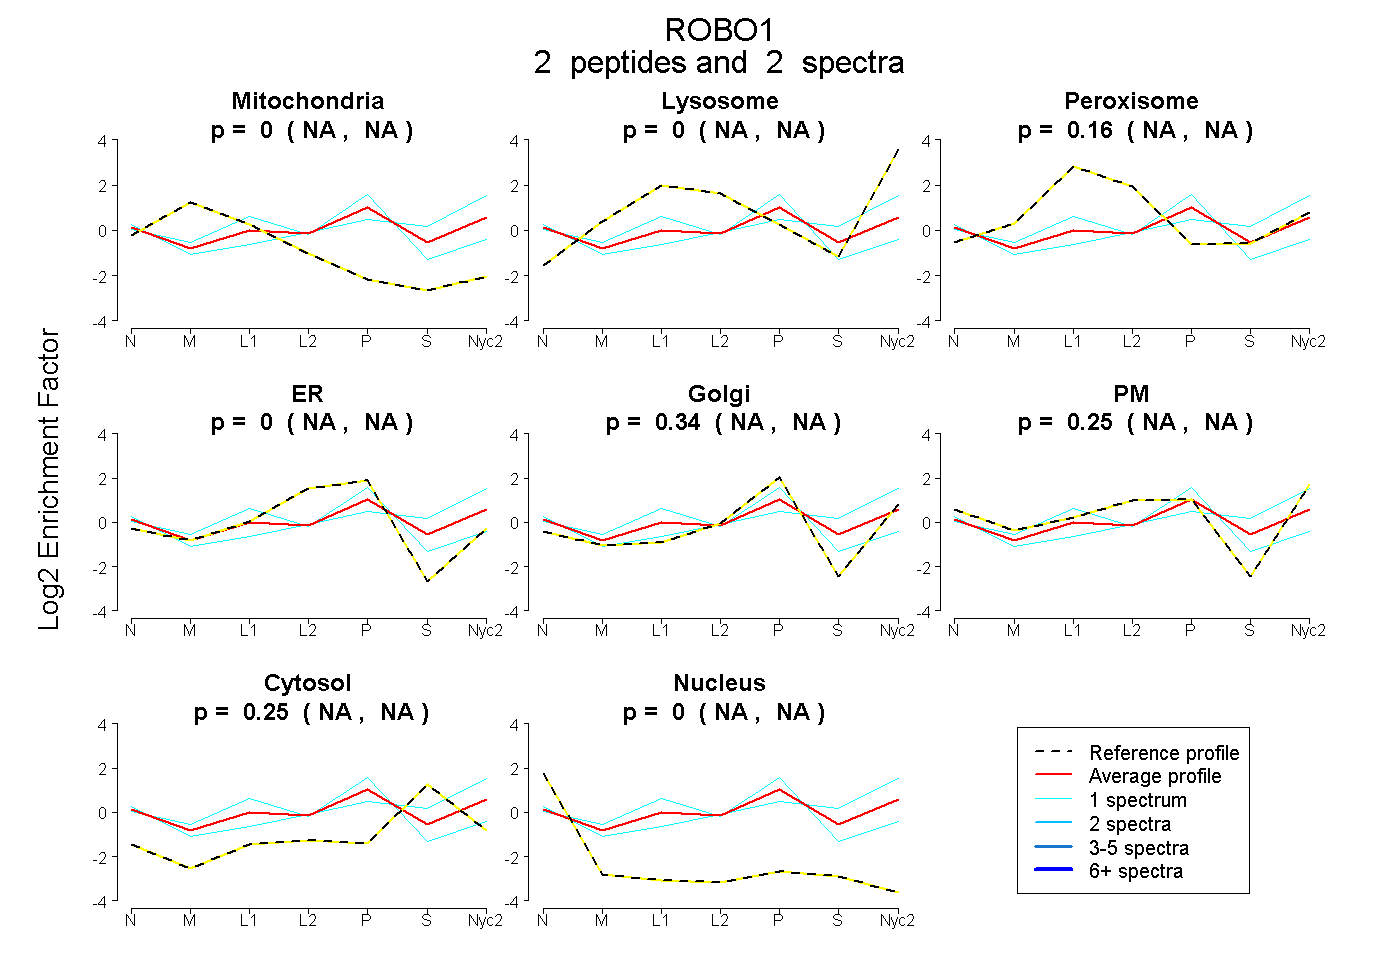
 2
2peptides
spectra
NA | NA
NA | NA
NA | NA
NA | NA
NA | NA
NA | NA
NA | NA
NA | NA
| Plot | Mito | Lyso | Perox | ER | Golgi | PM | Cytosol | Nucleus | |||||
| Expt A |
2 peptides |
2 spectra |
|
0.000 NA | NA |
0.000 NA | NA |
0.158 NA | NA |
0.000 NA | NA |
0.340 NA | NA |
0.246 NA | NA |
0.255 NA | NA |
0.000 NA | NA |
| 1 spectrum, SPSVQSK | 0.069 | 0.000 | 0.205 | 0.209 | 0.419 | 0.000 | 0.076 | 0.023 | ||
| 1 spectrum, AYLEVTDVIADRPPPVIR | 0.000 | 0.102 | 0.000 | 0.000 | 0.000 | 0.486 | 0.412 | 0.000 |
| Plot | Lyso | Other | |||||||||||
| Expt C |
1 peptide |
1 spectrum |
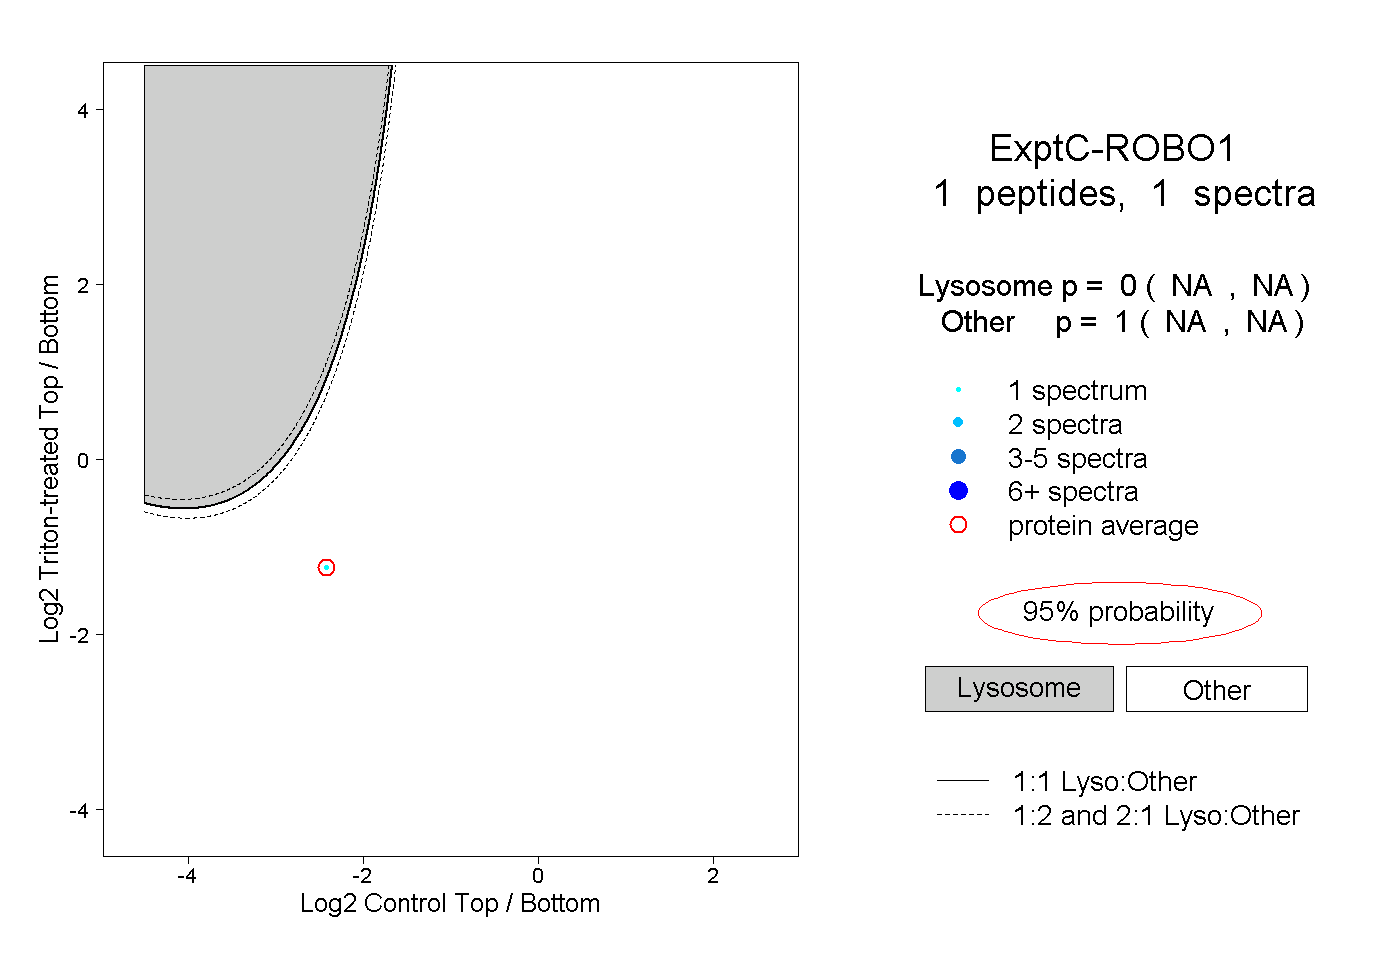 |
0.000 NA | NA |
1.000 NA | NA |