 8
8peptides
spectra

0.000 | 0.000
0.154 | 0.172
0.000 | 0.000
0.000 | 0.000
0.021 | 0.046
0.414 | 0.440
0.368 | 0.379
0.000 | 0.000
2peptides
spectra

0.000 | 0.000
0.151 | 0.215
0.000 | 0.000
0.108 | 0.163
0.394 | 0.469
0.223 | 0.256
0.000 | 0.000
5peptides
spectra
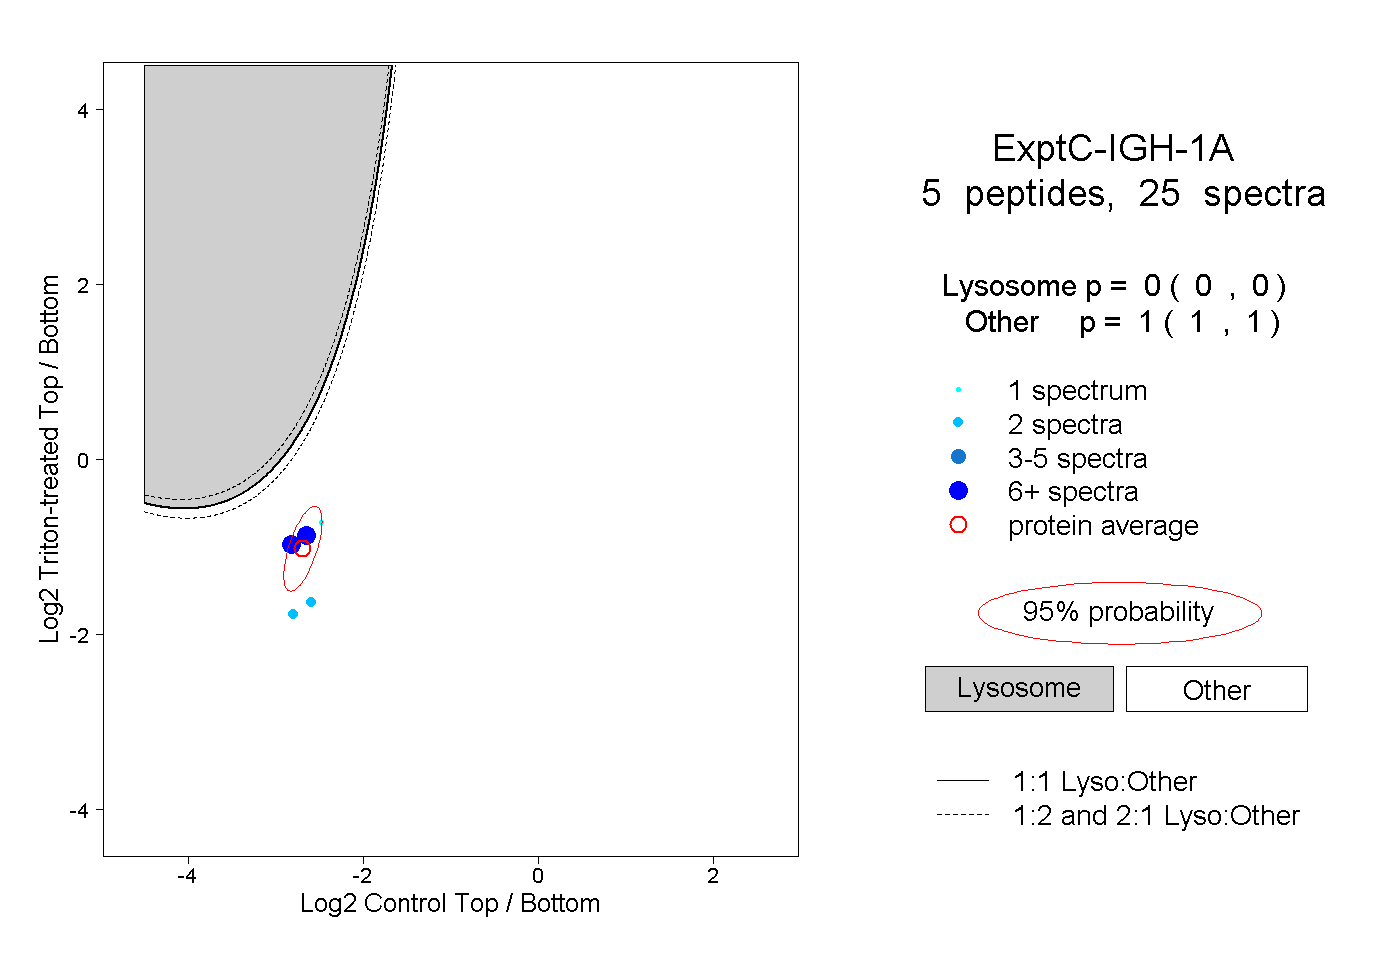
0.000 | 0.000
1.000 | 1.000
2peptides
spectra
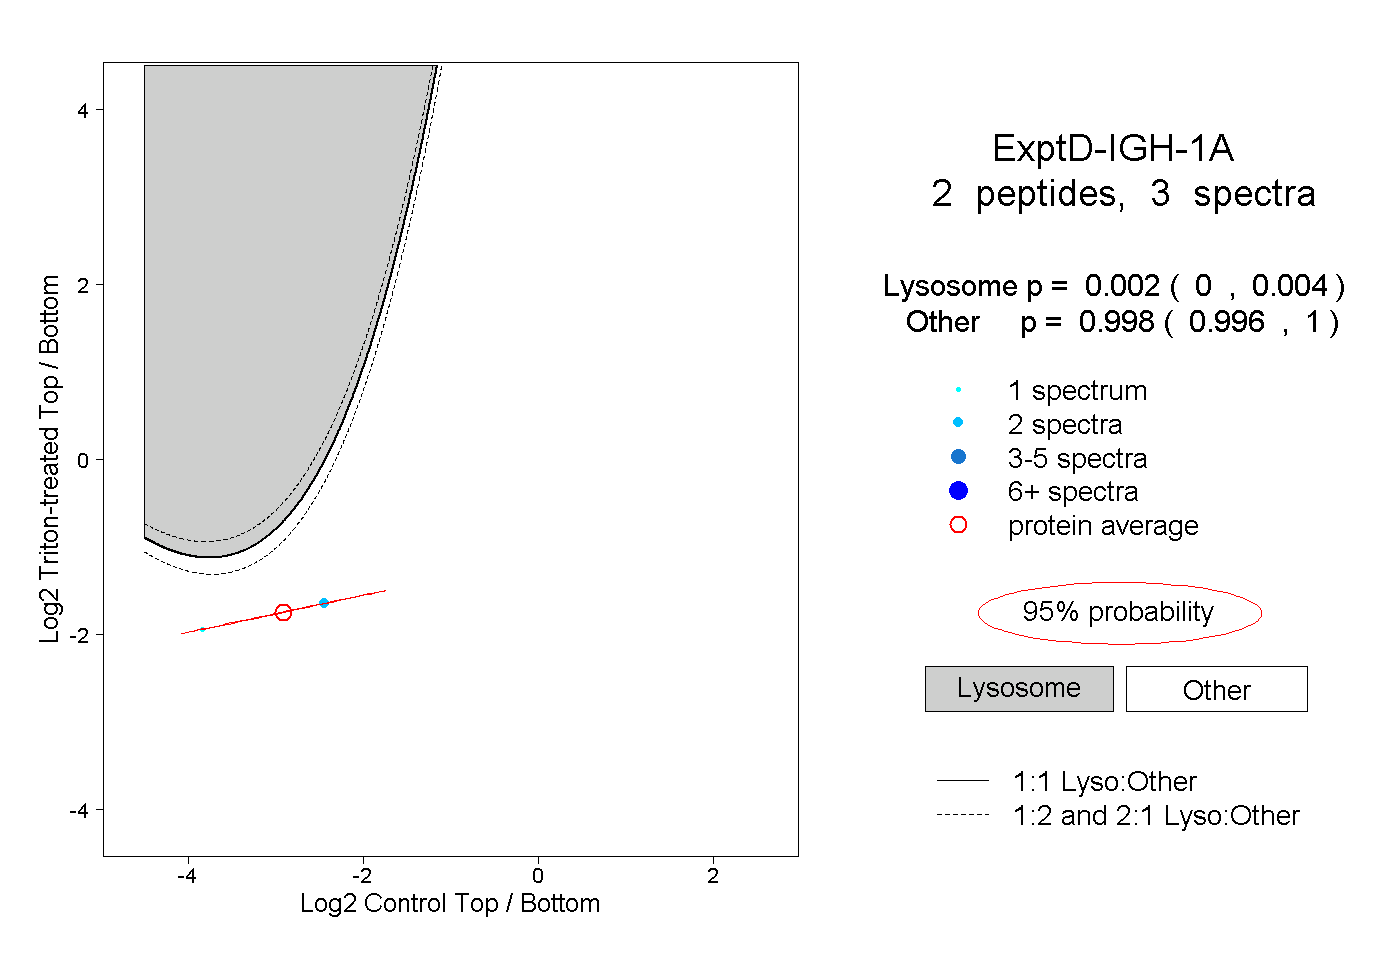
0.000 | 0.004
0.996 | 1.000