 19
19peptides
spectra
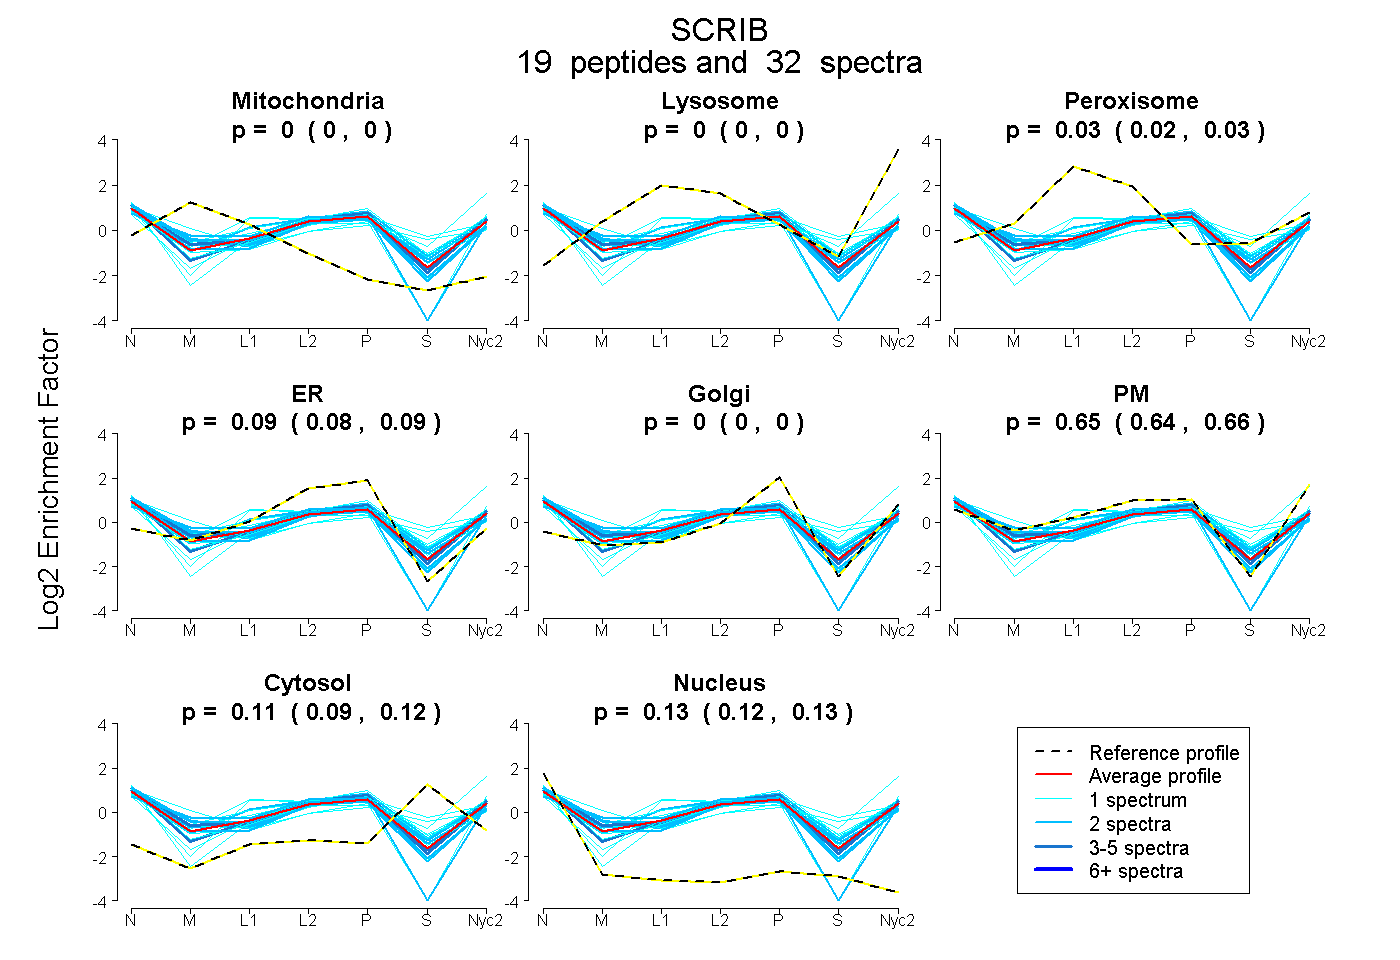
0.000 | 0.000
0.000 | 0.000
0.017 | 0.033
0.078 | 0.095
0.000 | 0.000
0.642 | 0.660
0.094 | 0.119
0.120 | 0.132
5peptides
spectra
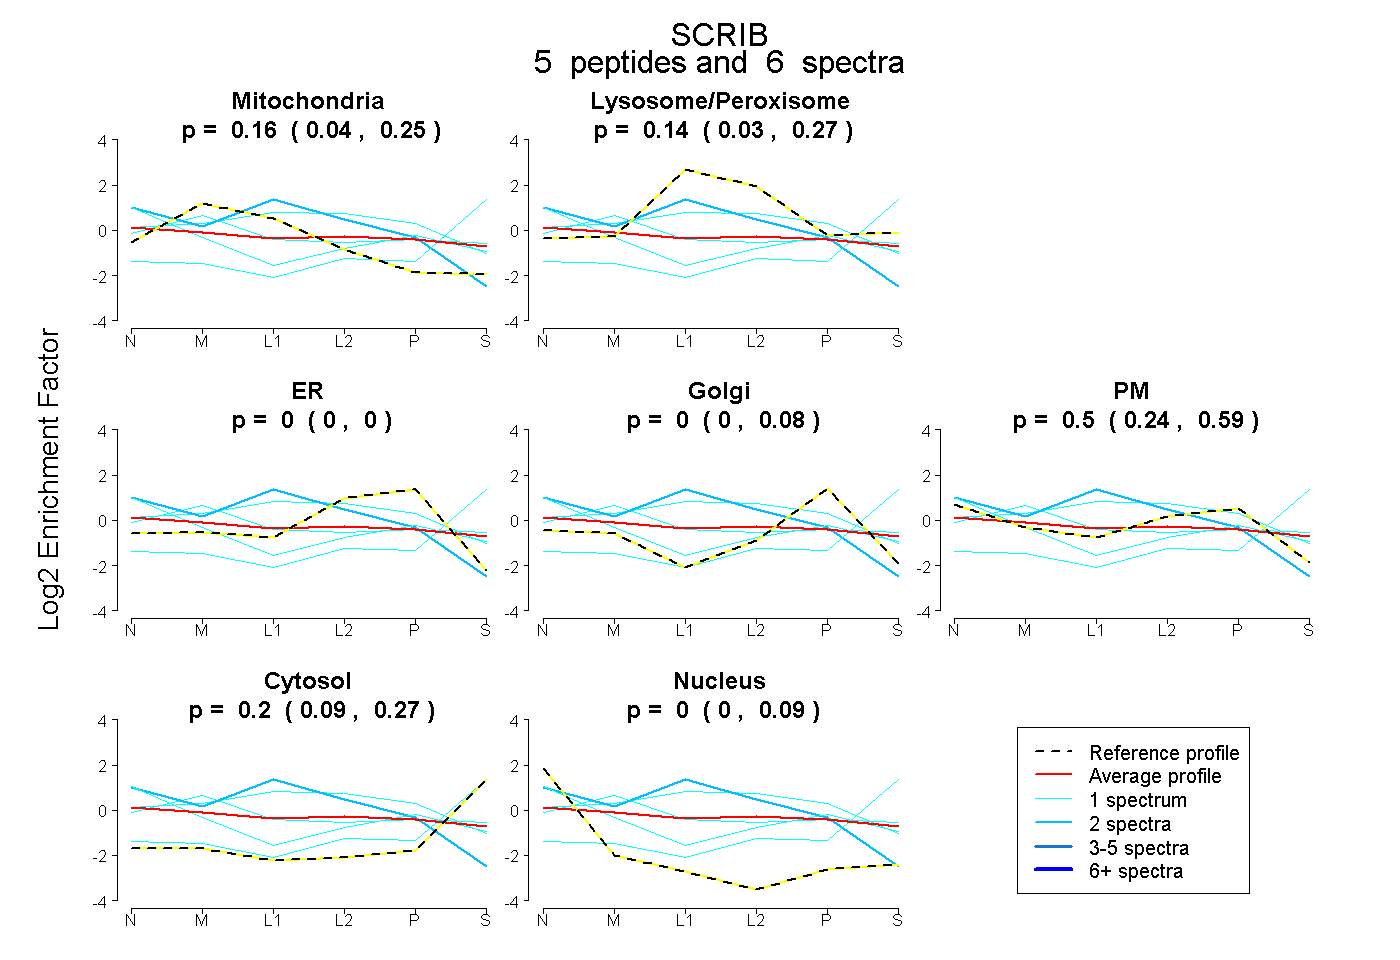
0.041 | 0.251
0.030 | 0.271
0.000 | 0.000
0.000 | 0.083
0.236 | 0.590
0.090 | 0.271
0.000 | 0.088
13peptides
spectra
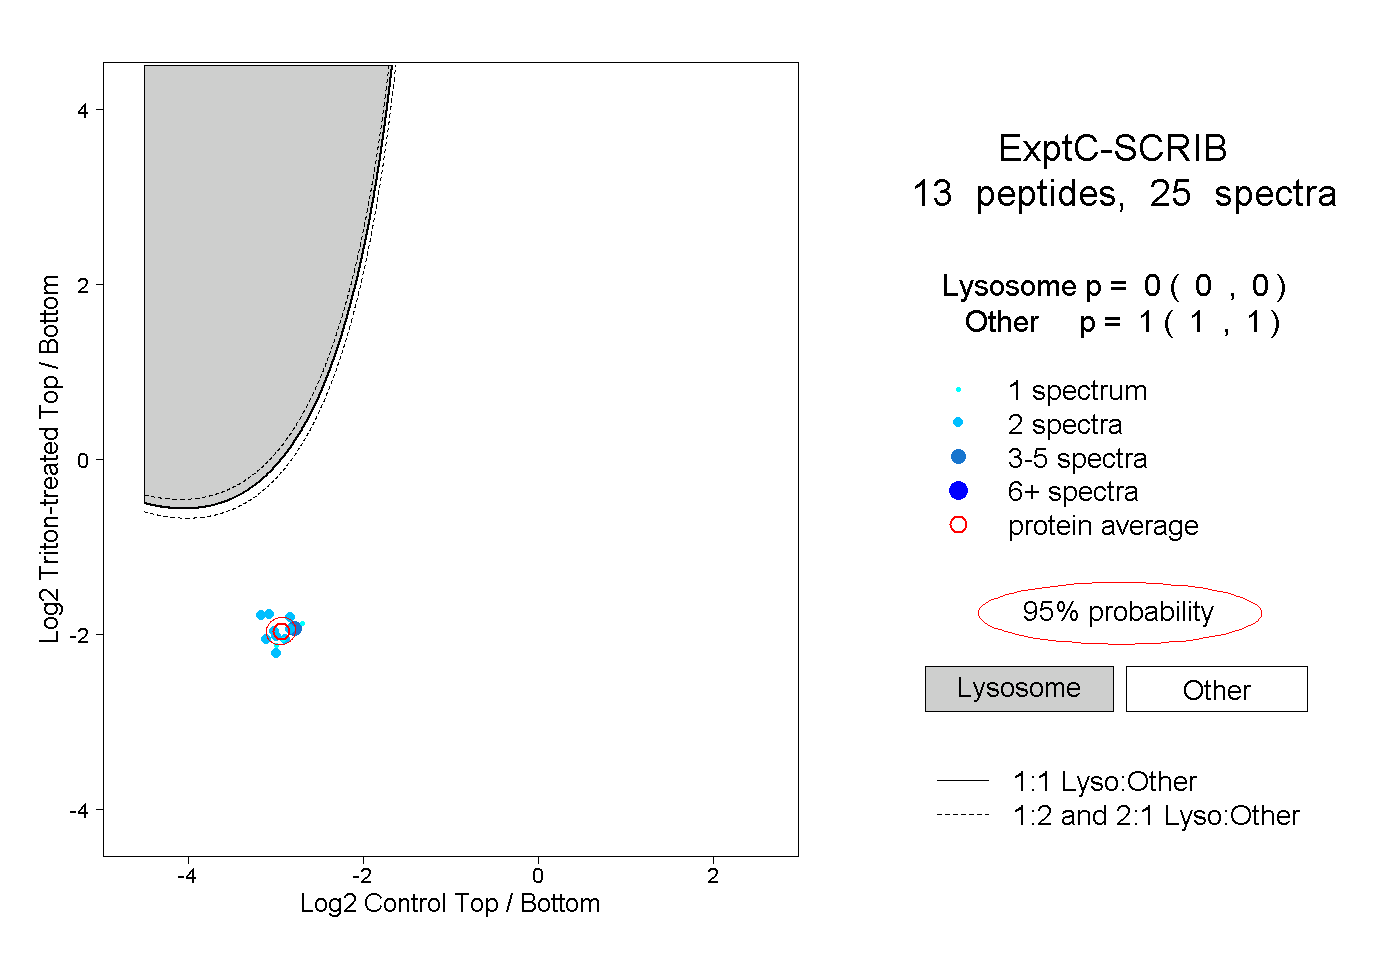
0.000 | 0.000
1.000 | 1.000