 2
2peptides
spectra
0.741 | 0.839
0.000 | 0.038
0.000 | 0.189
0.000 | 0.000
0.000 | 0.000
0.014 | 0.169
0.000 | 0.017
0.000 | 0.014
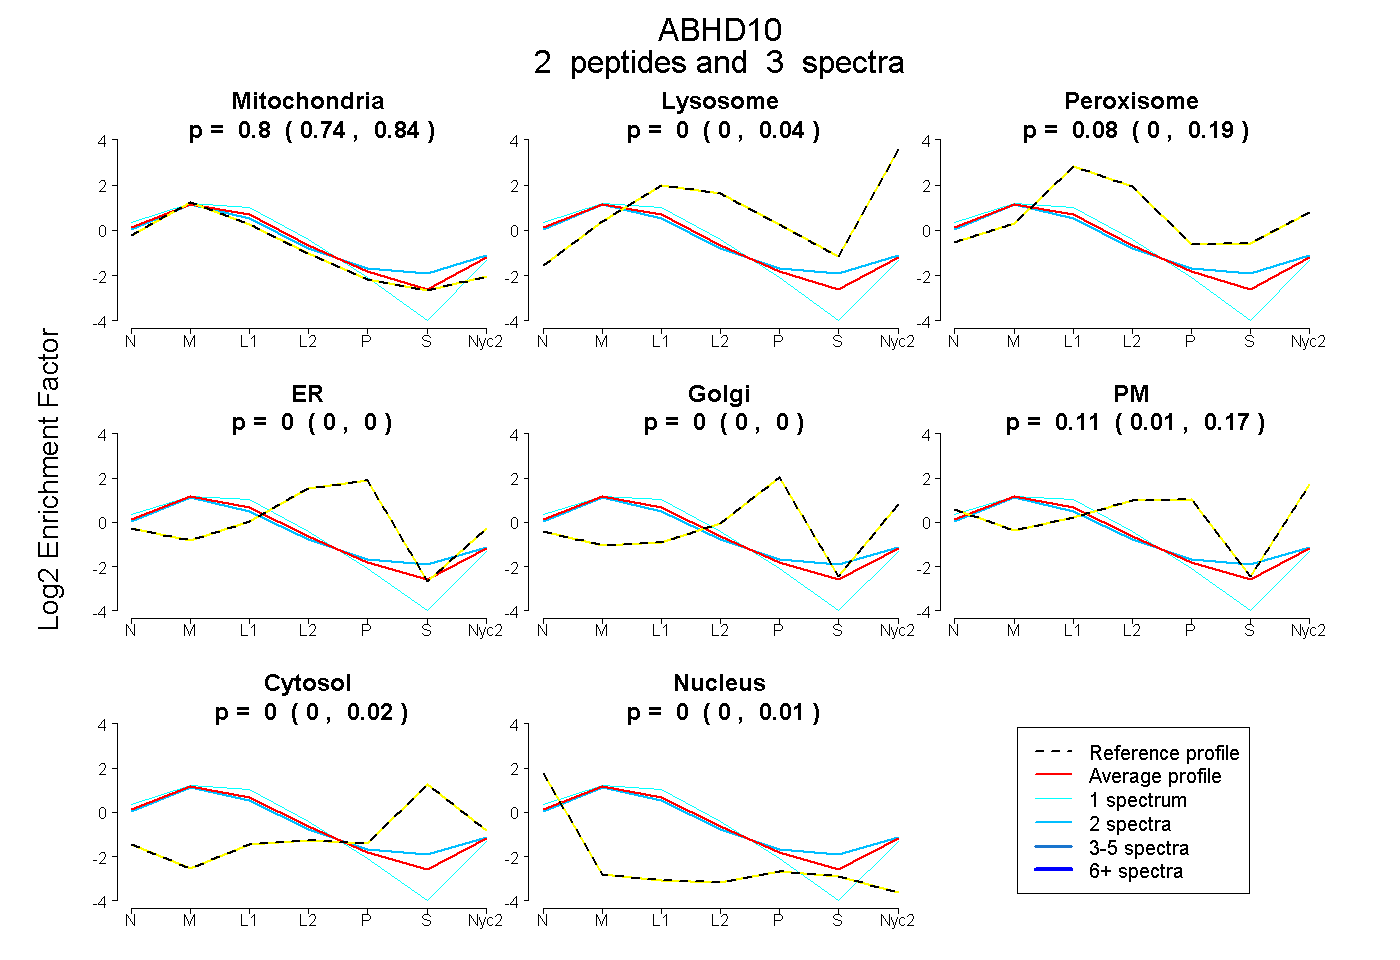
| Plot | Mito | Lyso | Perox | ER | Golgi | PM | Cytosol | Nucleus | |||||
| Expt A |
2 peptides |
3 spectra |
|
0.803 0.741 | 0.839 |
0.003 0.000 | 0.038 |
0.083 0.000 | 0.189 |
0.000 0.000 | 0.000 |
0.000 0.000 | 0.000 |
0.110 0.014 | 0.169 |
0.000 0.000 | 0.017 |
0.000 0.000 | 0.014 |
| 1 spectrum, RPELPSLAYK | 0.856 | 0.000 | 0.000 | 0.000 | 0.000 | 0.144 | 0.000 | 0.000 | ||
| 2 spectra, SLQVADR | 0.759 | 0.034 | 0.101 | 0.000 | 0.000 | 0.061 | 0.045 | 0.000 |
| Plot | Lyso | Other | |||||||||||
| Expt C |
6 peptides |
13 spectra |
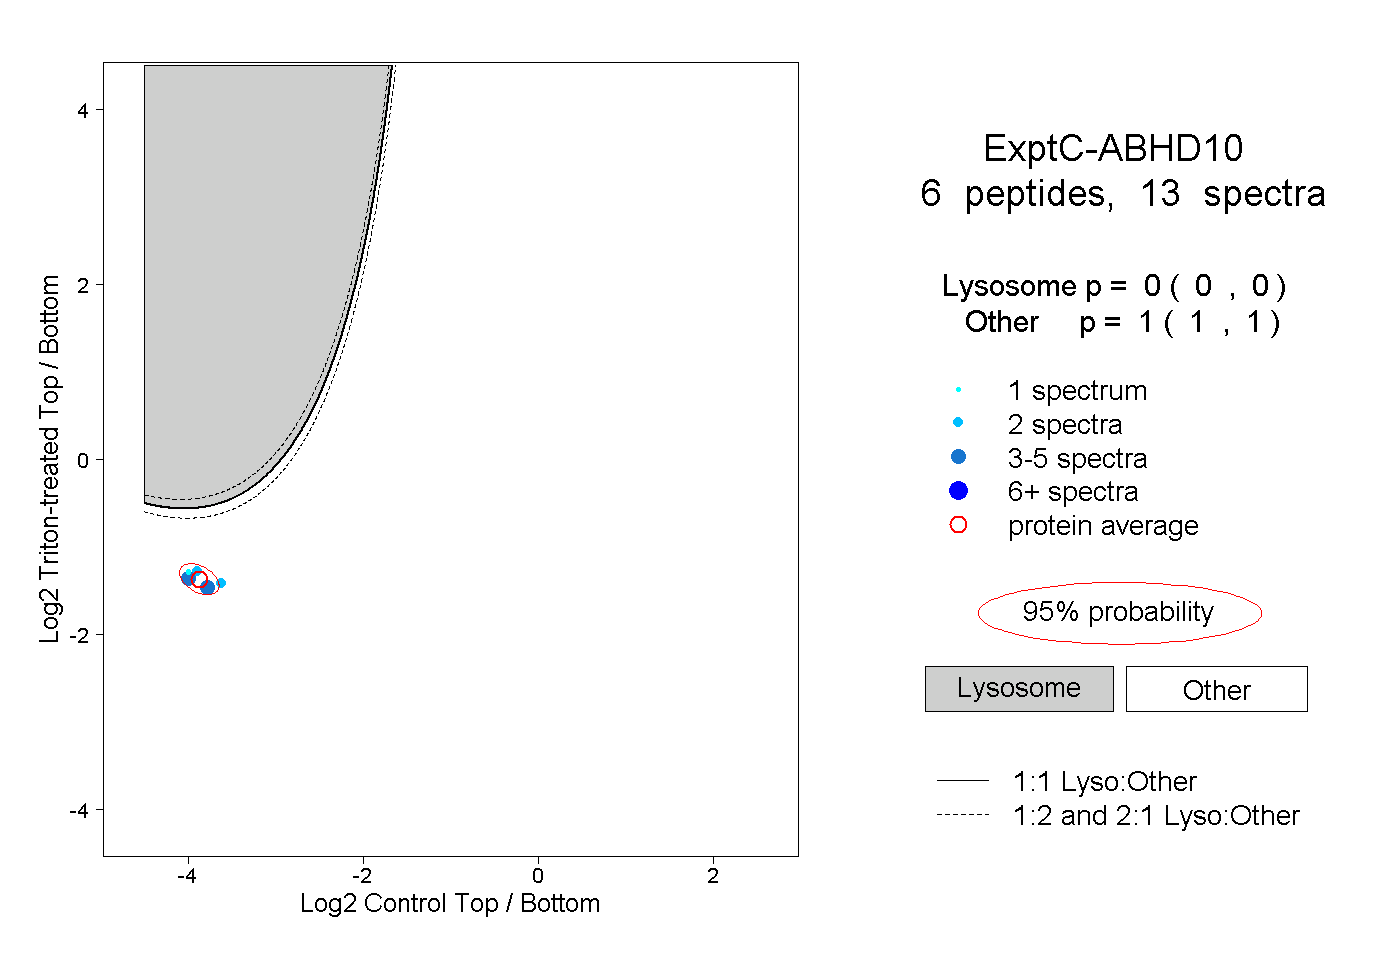 |
0.000 0.000 | 0.000 |
1.000 1.000 | 1.000 |