21
21peptides
spectra
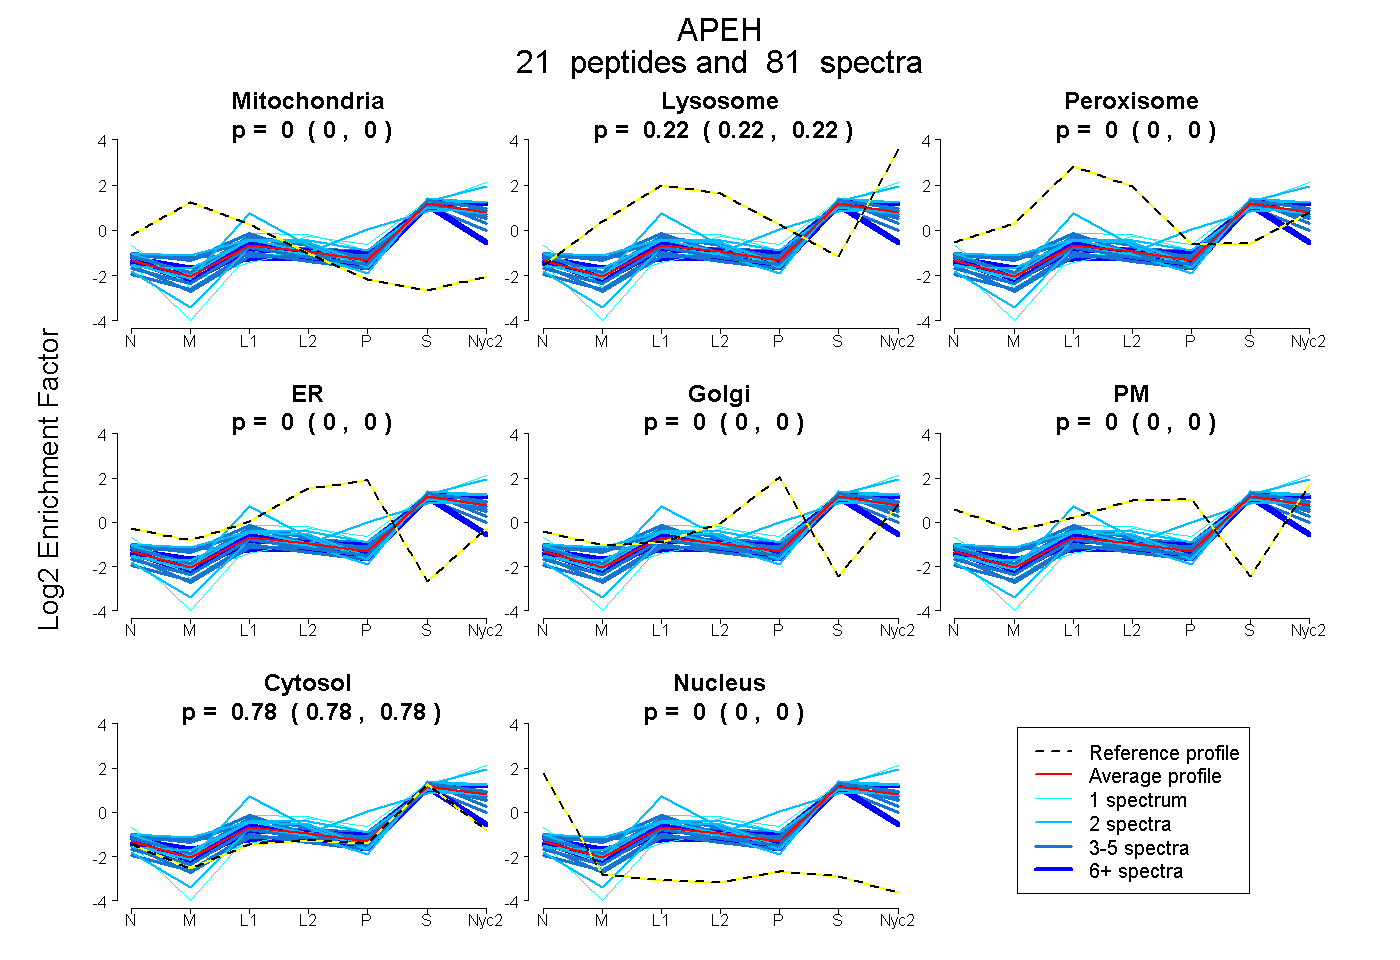
0.000 | 0.000
0.217 | 0.223
0.000 | 0.000
0.000 | 0.000
0.000 | 0.000
0.000 | 0.000
0.777 | 0.783
0.000 | 0.000
8peptides
spectra
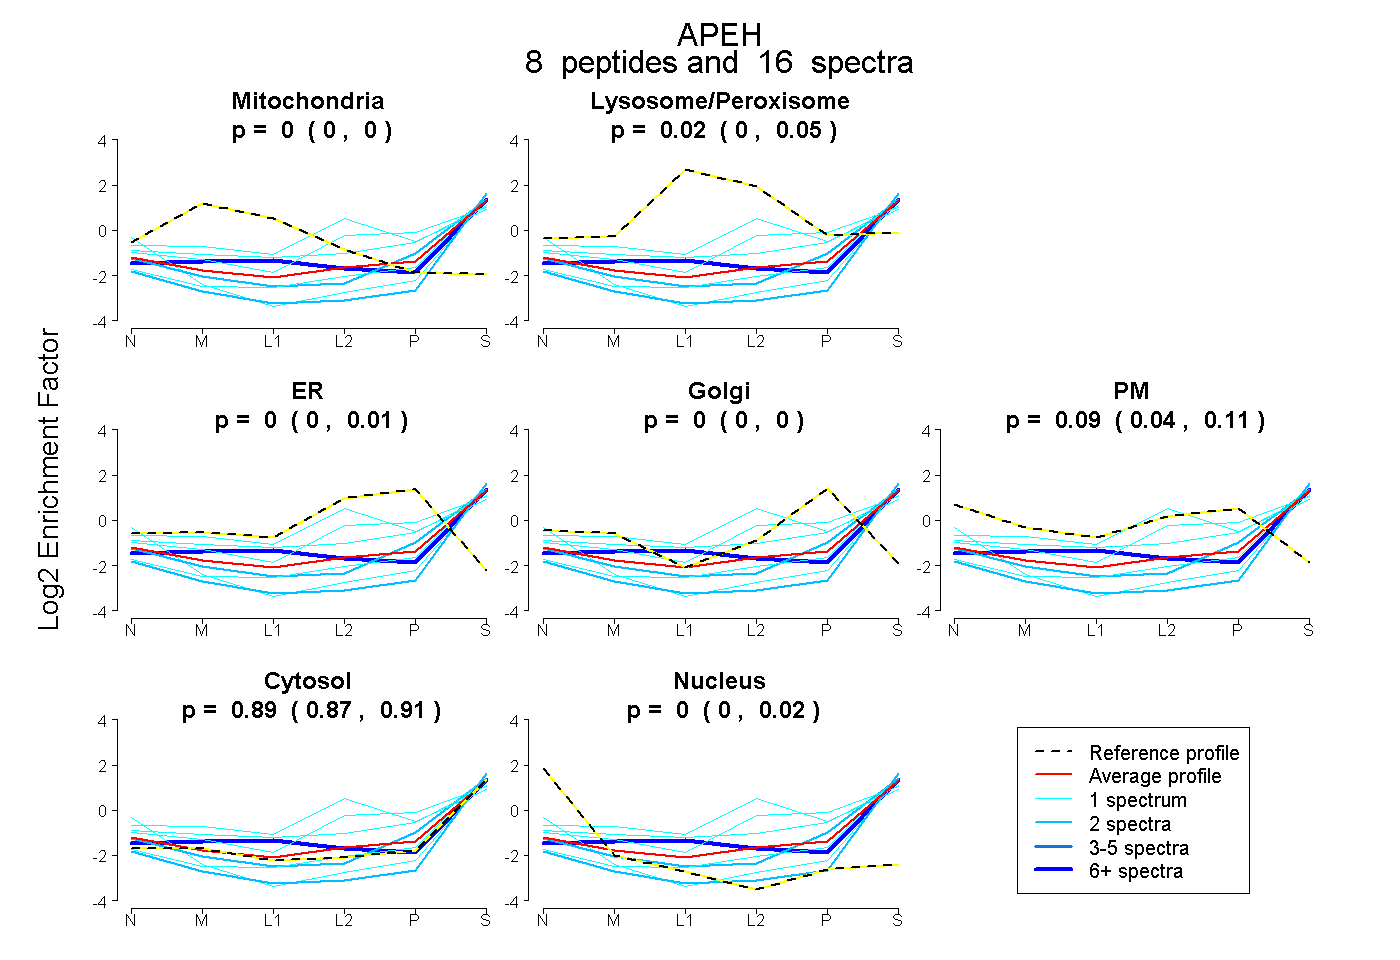
0.000 | 0.000
0.000 | 0.051
0.000 | 0.010
0.000 | 0.001
0.040 | 0.110
0.866 | 0.905
0.000 | 0.017