 21
21peptides
spectra
0.000 | 0.000
0.217 | 0.223
0.000 | 0.000
0.000 | 0.000
0.000 | 0.000
0.000 | 0.000
0.777 | 0.783
0.000 | 0.000
| Plot | Mito | Lyso | Perox | ER | Golgi | PM | Cytosol | Nucleus | |||||
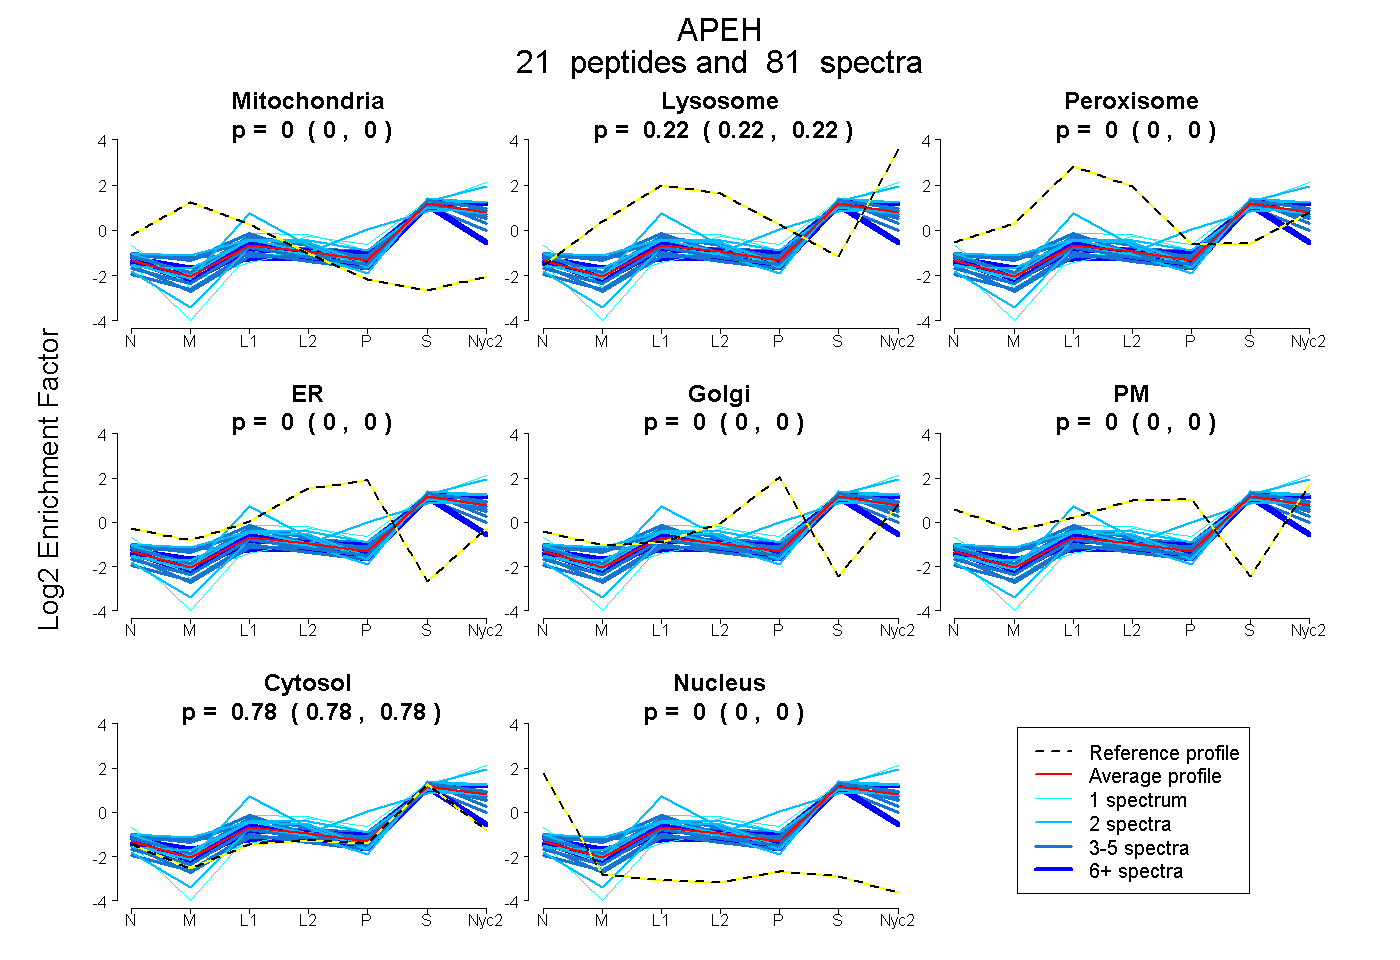
| Expt A |
21 peptides |
81 spectra |
|
0.000 0.000 | 0.000 |
0.220 0.217 | 0.223 |
0.000 0.000 | 0.000 |
0.000 0.000 | 0.000 |
0.000 0.000 | 0.000 |
0.000 0.000 | 0.000 |
0.780 0.777 | 0.783 |
0.000 0.000 | 0.000 |
| 13 spectra, LSPDQCR | 0.000 | 0.000 | 0.127 | 0.000 | 0.000 | 0.000 | 0.873 | 0.000 | ||
| 3 spectra, QFLEVWEK | 0.000 | 0.131 | 0.000 | 0.000 | 0.000 | 0.000 | 0.869 | 0.000 | ||
| 3 spectra, TPVLLMLGQEDR | 0.000 | 0.283 | 0.000 | 0.000 | 0.000 | 0.000 | 0.717 | 0.000 | ||
| 14 spectra, QGMEYYR | 0.000 | 0.268 | 0.000 | 0.000 | 0.000 | 0.000 | 0.732 | 0.000 | ||
| 6 spectra, DVQFAVEQVLQEEHFDAR | 0.000 | 0.209 | 0.000 | 0.000 | 0.000 | 0.000 | 0.791 | 0.000 | ||
| 4 spectra, ESPSGTMK | 0.000 | 0.198 | 0.000 | 0.000 | 0.000 | 0.000 | 0.802 | 0.000 | ||
| 1 spectrum, GELLSR | 0.000 | 0.150 | 0.000 | 0.000 | 0.000 | 0.000 | 0.850 | 0.000 | ||
| 2 spectra, VTSVVVDIVPR | 0.000 | 0.352 | 0.000 | 0.000 | 0.000 | 0.000 | 0.648 | 0.000 | ||
| 2 spectra, VVFDSAQR | 0.000 | 0.147 | 0.000 | 0.000 | 0.000 | 0.000 | 0.853 | 0.000 | ||
| 4 spectra, AESFFQTK | 0.100 | 0.123 | 0.000 | 0.000 | 0.000 | 0.000 | 0.778 | 0.000 | ||
| 6 spectra, ALDISASDDEMARPK | 0.109 | 0.037 | 0.000 | 0.000 | 0.000 | 0.000 | 0.855 | 0.000 | ||
| 3 spectra, QYLVFHDGDSVVFAGPAGNSVETR | 0.000 | 0.094 | 0.000 | 0.000 | 0.000 | 0.000 | 0.906 | 0.000 | ||
| 2 spectra, SFNLSALEK | 0.000 | 0.236 | 0.000 | 0.000 | 0.123 | 0.000 | 0.641 | 0.000 | ||
| 1 spectrum, KPDQAIK | 0.000 | 0.137 | 0.000 | 0.000 | 0.000 | 0.000 | 0.863 | 0.000 | ||
| 3 spectra, LLLYPK | 0.000 | 0.320 | 0.000 | 0.000 | 0.000 | 0.000 | 0.680 | 0.000 | ||
| 2 spectra, VGFLPPPGK | 0.000 | 0.300 | 0.042 | 0.000 | 0.000 | 0.000 | 0.658 | 0.000 | ||
| 1 spectrum, EQSVSWVSLEEAEPIPGIHWGVR | 0.000 | 0.173 | 0.000 | 0.000 | 0.000 | 0.000 | 0.827 | 0.000 | ||
| 4 spectra, YIPQVK | 0.000 | 0.189 | 0.000 | 0.000 | 0.000 | 0.000 | 0.811 | 0.000 | ||
| 1 spectrum, MGFAVLLVNYR | 0.000 | 0.401 | 0.000 | 0.000 | 0.000 | 0.000 | 0.599 | 0.000 | ||
| 2 spectra, TVHTEWTQR | 0.000 | 0.299 | 0.033 | 0.000 | 0.000 | 0.000 | 0.667 | 0.000 | ||
| 4 spectra, SALFYVDLSGGK | 0.000 | 0.274 | 0.022 | 0.000 | 0.000 | 0.000 | 0.704 | 0.000 |
| Plot | Mito | Lyso or Perox | ER | Golgi | PM | Cytosol | Nucleus | ||||||
| Expt B |
8 peptides |
16 spectra |
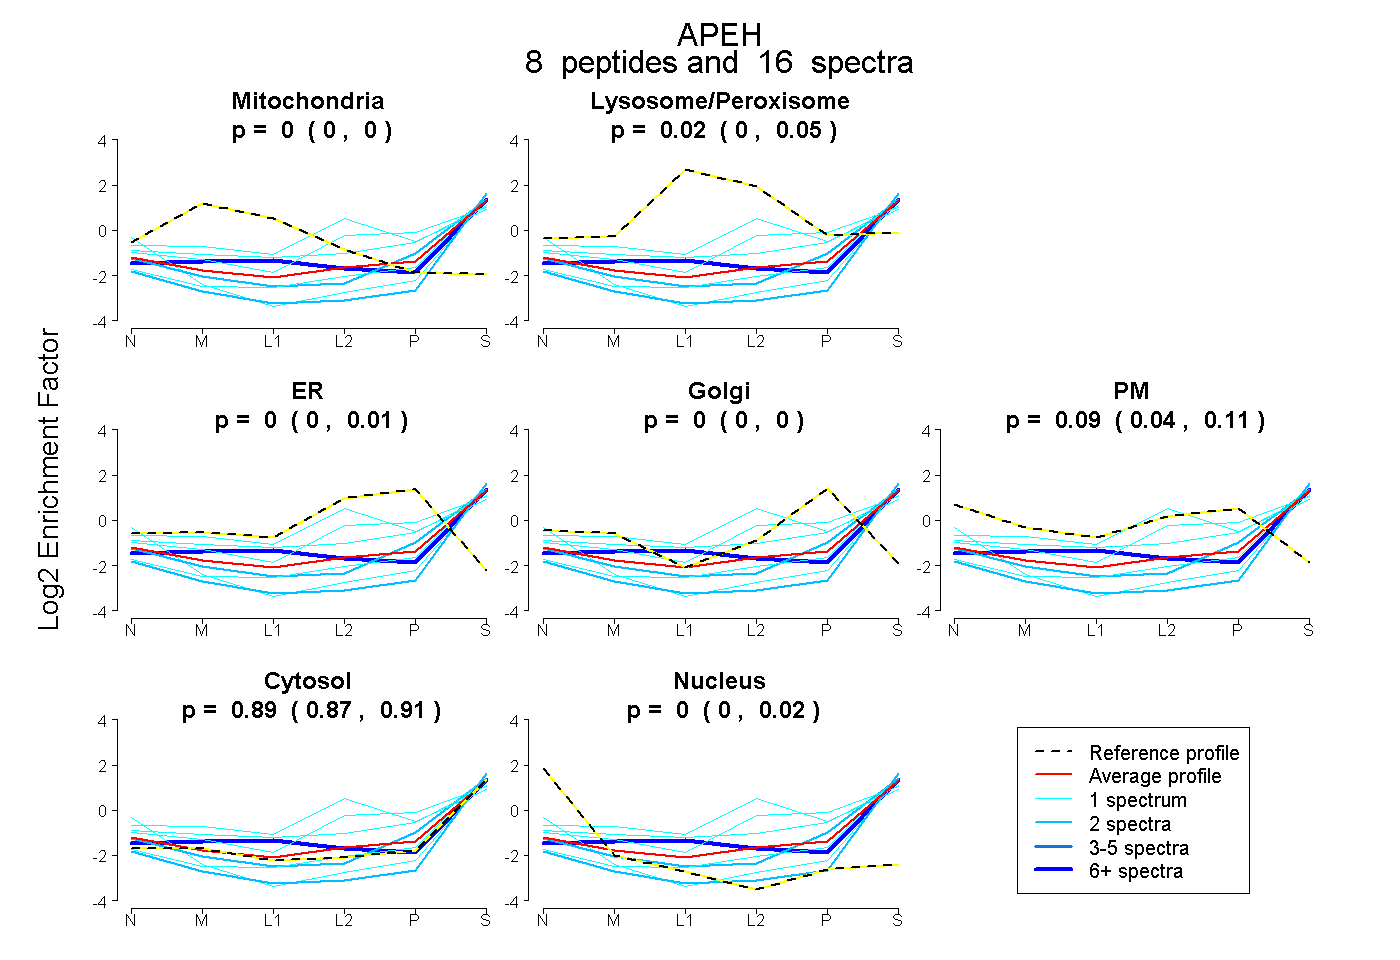 |
0.000 0.000 | 0.000 |
0.018 0.000 | 0.051 |
0.000 0.000 | 0.010 |
0.000 0.000 | 0.001 |
0.092 0.040 | 0.110 |
0.890 0.866 | 0.905 |
0.000 0.000 | 0.017 |
|||
| Plot | Lyso | Other | |||||||||||
| Expt C |
18 peptides |
104 spectra |
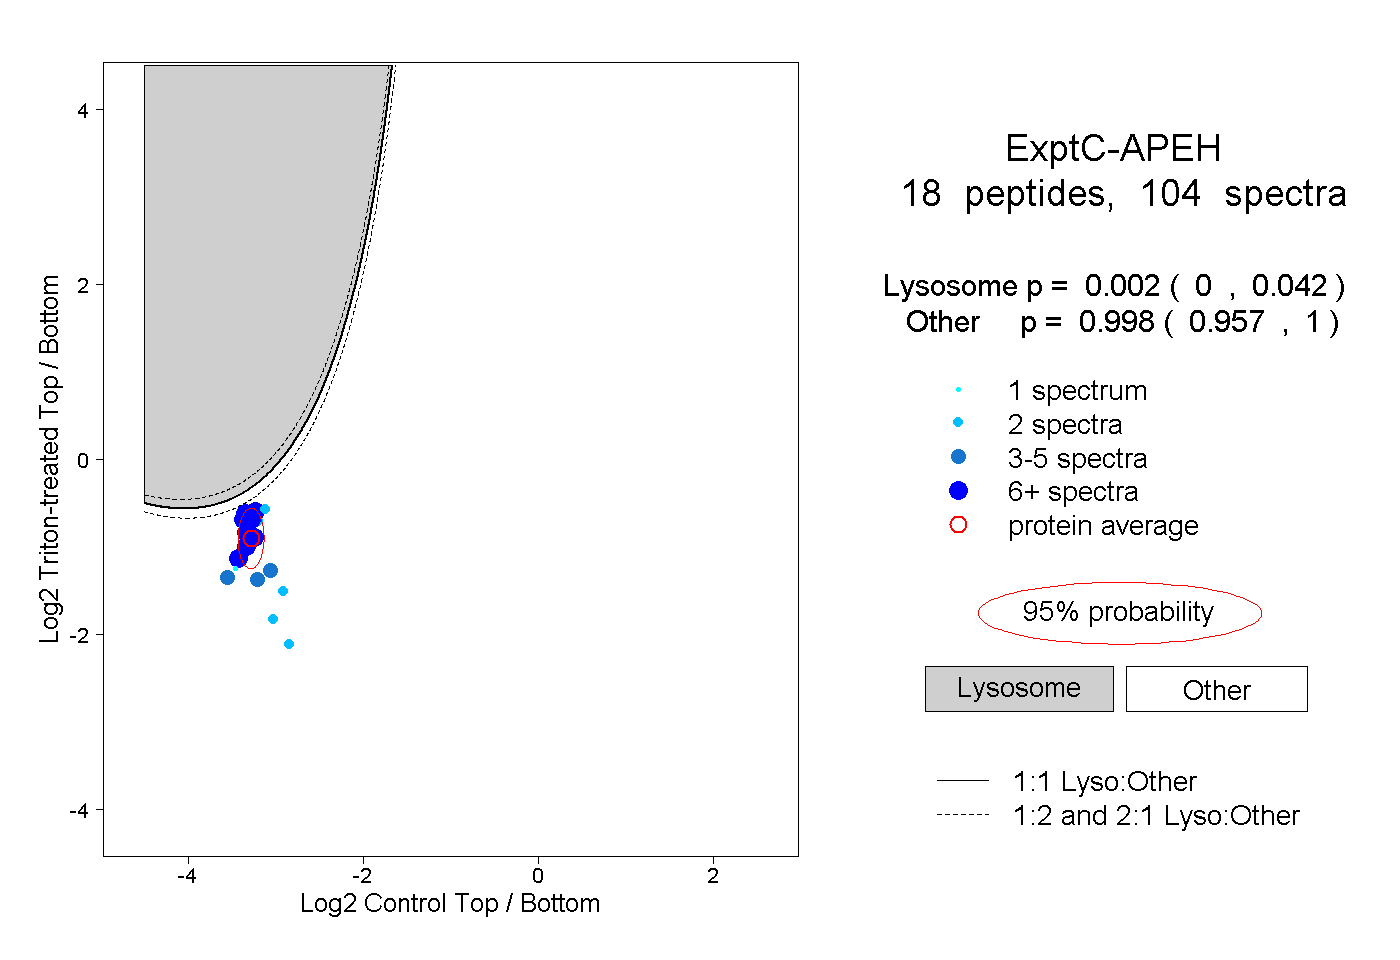 |
0.002 0.000 | 0.042 |
0.998 0.957 | 1.000 |
||||||||
| Plot | Lyso | Other | |||||||||||
| Expt D |
5 peptides |
11 spectra |
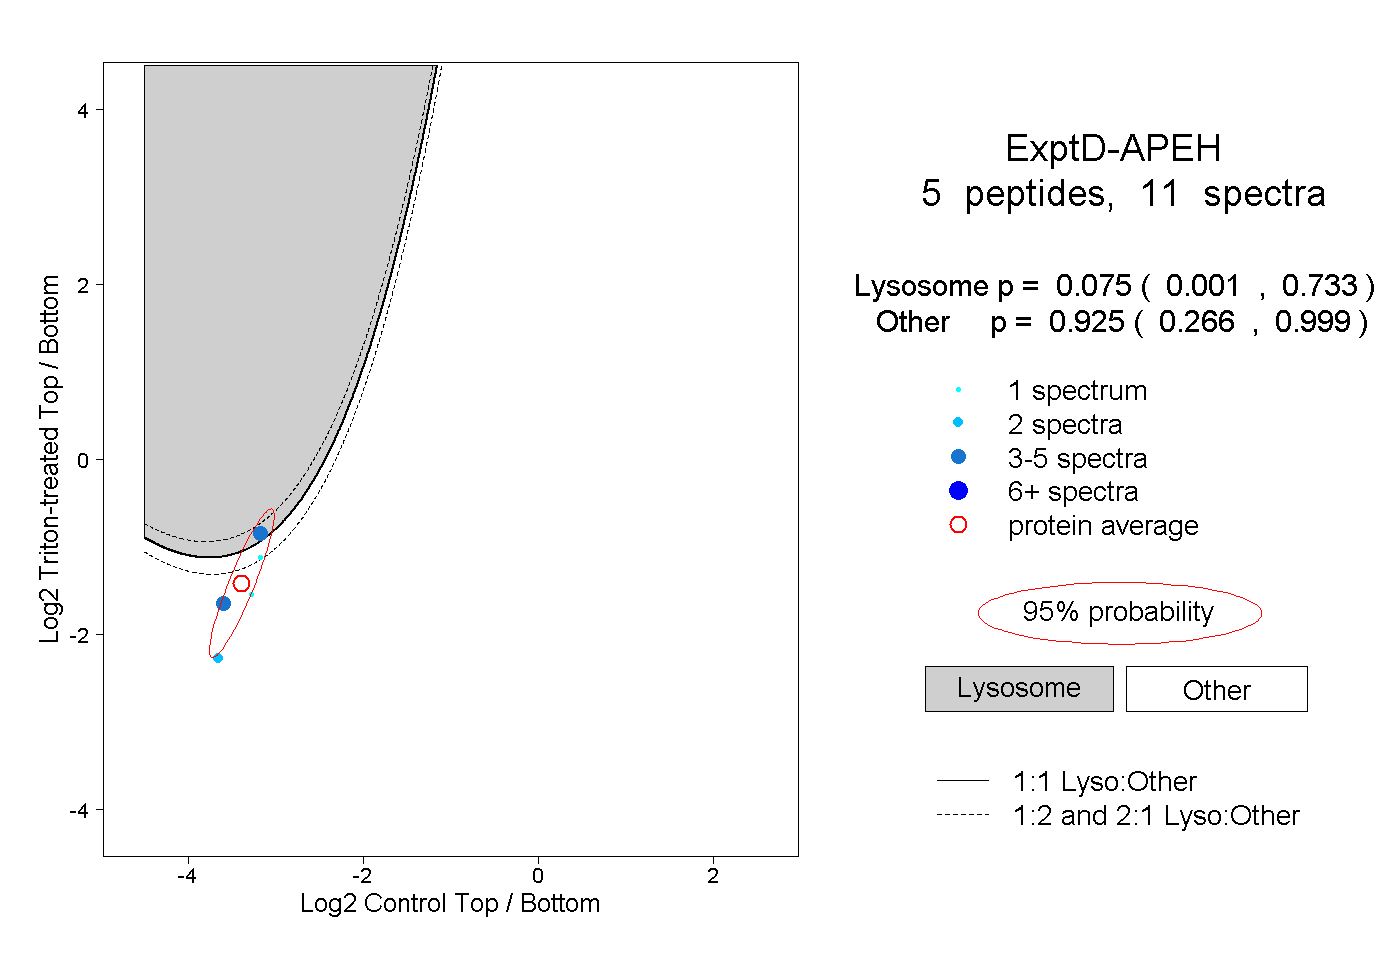 |
0.075 0.001 | 0.733 |
0.925 0.266 | 0.999 |