 3
3peptides
spectra

0.000 | 0.026
0.000 | 0.000
0.000 | 0.085
0.799 | 0.941
0.000 | 0.048
0.000 | 0.104
0.000 | 0.000
0.018 | 0.045
2peptides
spectra
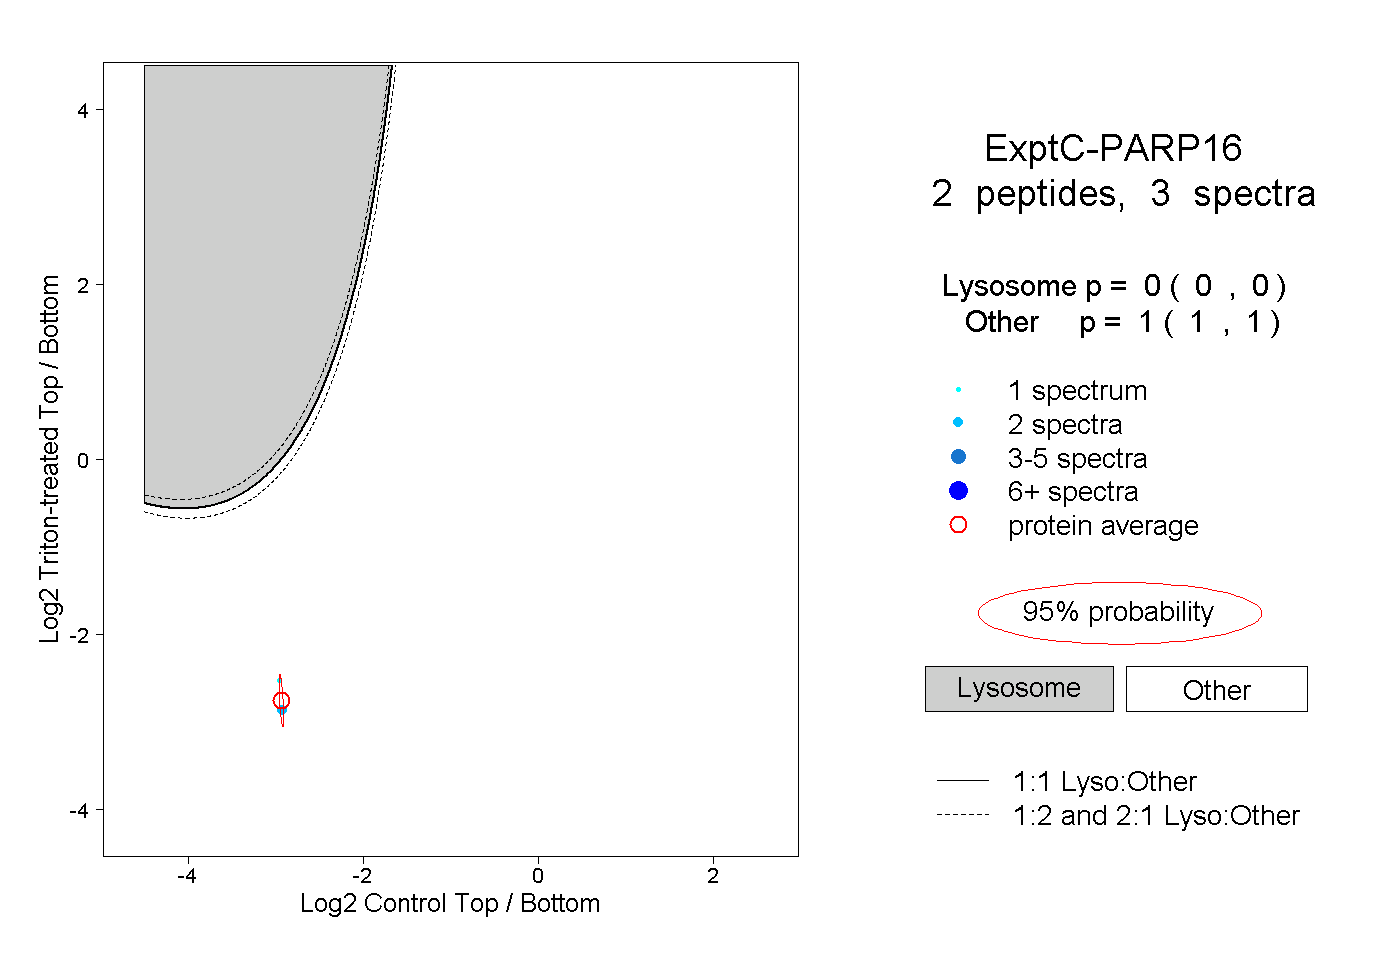
0.000 | 0.000
1.000 | 1.000
1peptide
spectra
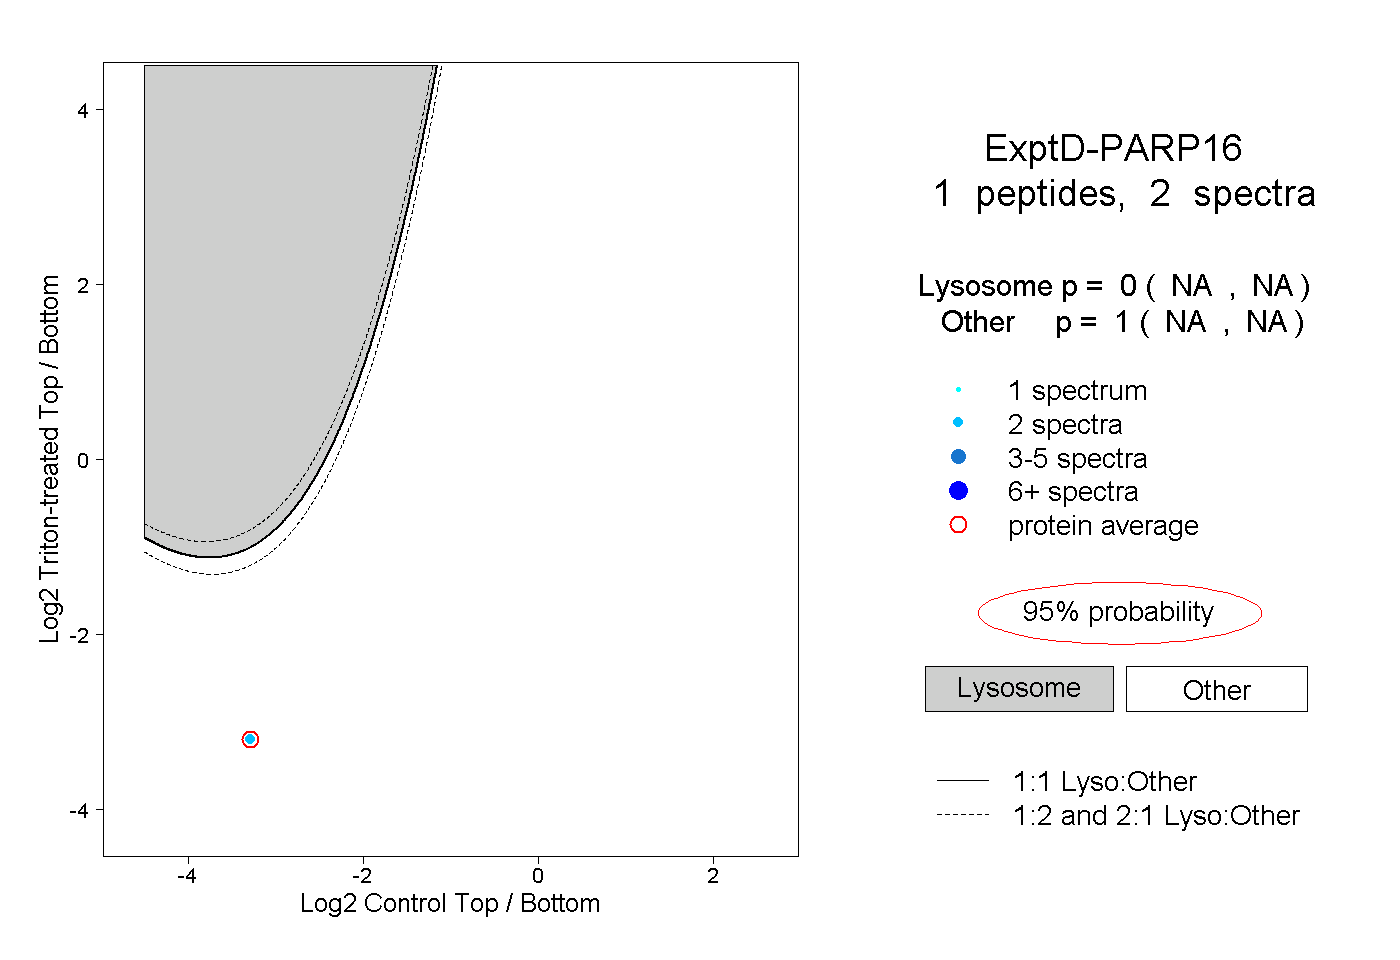
NA | NA
NA | NA