 15
15peptides
spectra
0.000 | 0.000
0.000 | 0.000
0.000 | 0.000
0.000 | 0.000
0.000 | 0.000
0.000 | 0.000
0.979 | 0.982
0.018 | 0.020
| Plot | Mito | Lyso | Perox | ER | Golgi | PM | Cytosol | Nucleus | |||||
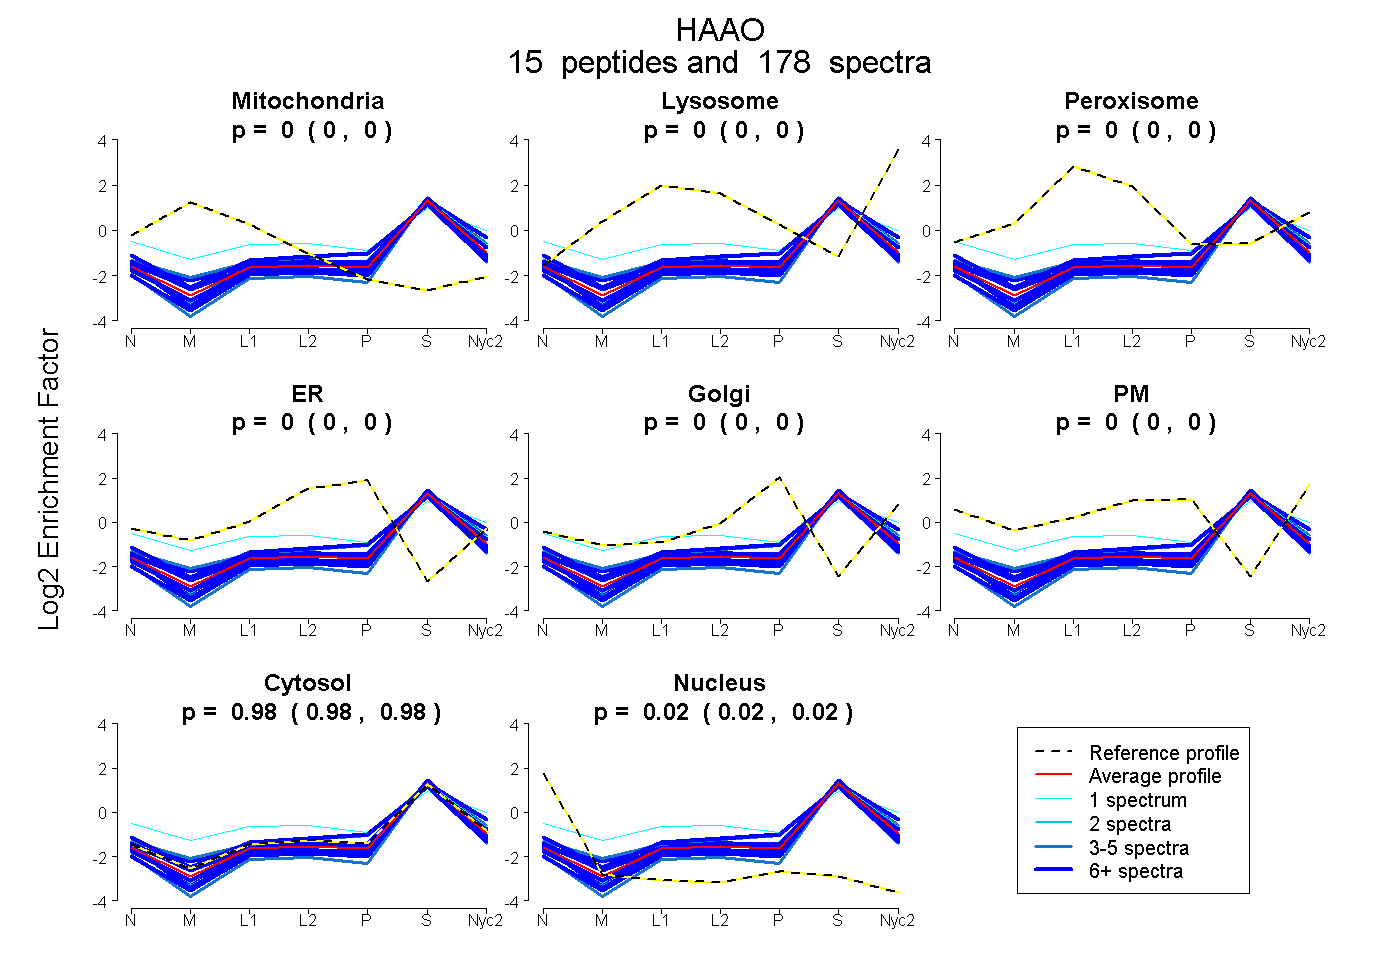
| Expt A |
15 peptides |
178 spectra |
|
0.000 0.000 | 0.000 |
0.000 0.000 | 0.000 |
0.000 0.000 | 0.000 |
0.000 0.000 | 0.000 |
0.000 0.000 | 0.000 |
0.000 0.000 | 0.000 |
0.981 0.979 | 0.982 |
0.019 0.018 | 0.020 |
| 4 spectra, DLGTQLAPIIQEFFHSEQYR | 0.000 | 0.000 | 0.000 | 0.000 | 0.000 | 0.000 | 0.941 | 0.059 | ||
| 11 spectra, YYVGDTEDVLFEK | 0.000 | 0.000 | 0.000 | 0.000 | 0.000 | 0.000 | 0.970 | 0.030 | ||
| 5 spectra, LMHQEQLK | 0.016 | 0.008 | 0.001 | 0.000 | 0.060 | 0.000 | 0.916 | 0.000 | ||
| 8 spectra, QGEIFLLPAR | 0.000 | 0.000 | 0.000 | 0.000 | 0.000 | 0.000 | 0.987 | 0.013 | ||
| 18 spectra, EPPFPLSTR | 0.000 | 0.000 | 0.000 | 0.000 | 0.000 | 0.000 | 0.965 | 0.035 | ||
| 4 spectra, AWLESHSR | 0.000 | 0.000 | 0.000 | 0.000 | 0.000 | 0.000 | 1.000 | 0.000 | ||
| 1 spectrum, SVMEPMSLK | 0.000 | 0.000 | 0.000 | 0.000 | 0.000 | 0.000 | 1.000 | 0.000 | ||
| 32 spectra, VPHSPQR | 0.000 | 0.000 | 0.000 | 0.000 | 0.000 | 0.000 | 0.956 | 0.044 | ||
| 18 spectra, METELDGLR | 0.000 | 0.000 | 0.000 | 0.000 | 0.000 | 0.000 | 1.000 | 0.000 | ||
| 8 spectra, FANTMGLVIER | 0.000 | 0.036 | 0.000 | 0.000 | 0.000 | 0.000 | 0.964 | 0.000 | ||
| 39 spectra, IMFVGGPNTR | 0.000 | 0.000 | 0.000 | 0.000 | 0.000 | 0.000 | 0.973 | 0.027 | ||
| 7 spectra, VLEQGEHR | 0.000 | 0.000 | 0.000 | 0.047 | 0.000 | 0.000 | 0.914 | 0.038 | ||
| 18 spectra, SWVEENR | 0.000 | 0.000 | 0.000 | 0.000 | 0.000 | 0.000 | 0.965 | 0.035 | ||
| 4 spectra, ASFQPPVCNK | 0.018 | 0.000 | 0.000 | 0.000 | 0.000 | 0.000 | 0.941 | 0.041 | ||
| 1 spectrum, AQGSVALSVTQDPACK | 0.000 | 0.002 | 0.169 | 0.000 | 0.000 | 0.137 | 0.692 | 0.000 |
| Plot | Mito | Lyso or Perox | ER | Golgi | PM | Cytosol | Nucleus | ||||||
| Expt B |
13 peptides |
84 spectra |
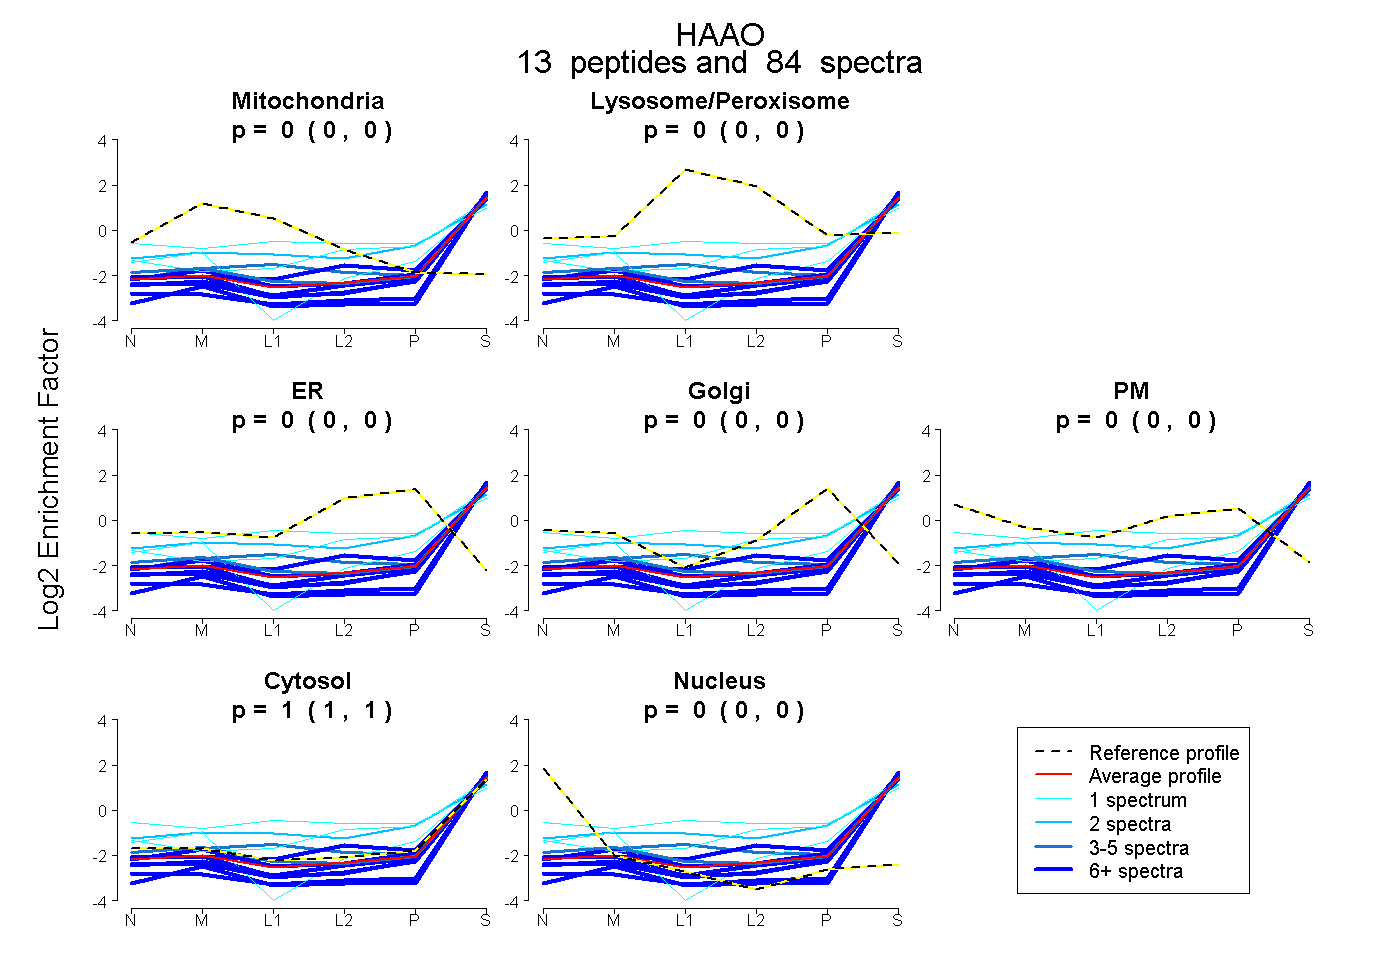 |
0.000 0.000 | 0.000 |
0.000 0.000 | 0.000 |
0.000 0.000 | 0.000 |
0.000 0.000 | 0.000 |
0.000 0.000 | 0.000 |
1.000 1.000 | 1.000 |
0.000 0.000 | 0.000 |
|||
| Plot | Lyso | Other | |||||||||||
| Expt C |
17 peptides |
204 spectra |
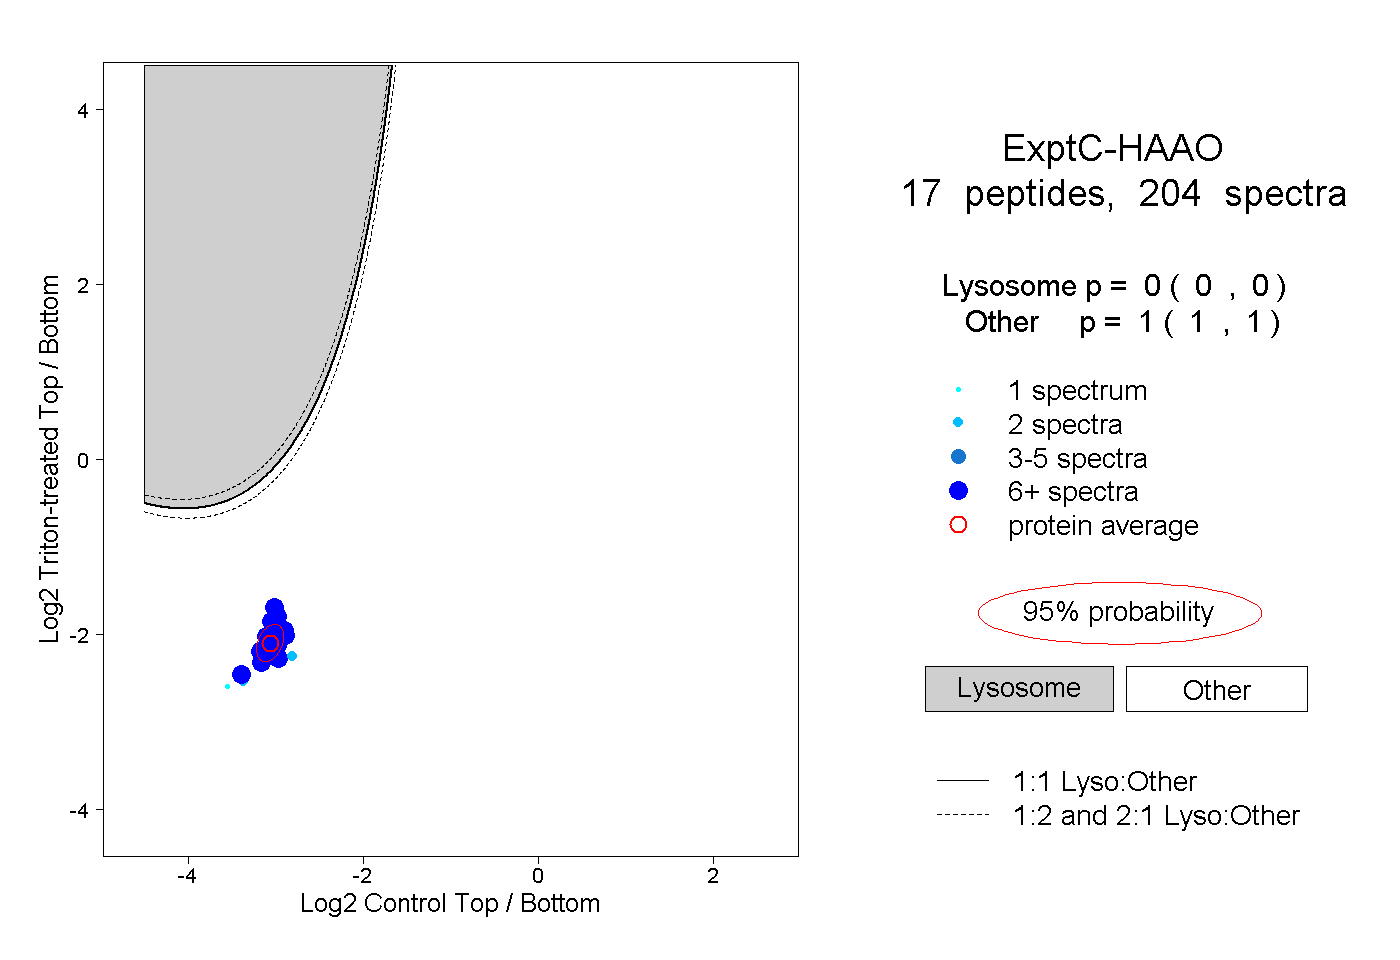 |
0.000 0.000 | 0.000 |
1.000 1.000 | 1.000 |
||||||||
| Plot | Lyso | Other | |||||||||||
| Expt D |
10 peptides |
18 spectra |
 |
0.000 0.000 | 0.002 |
1.000 0.998 | 1.000 |