PRPS1
[ENSRNOP00000043734]
Main page
| | | Plot |
Mito |
Lyso |
|
Perox |
ER |
Golgi |
PM |
Cytosol |
Nucleus |
|
| Expt A |
 11
11
peptides |
34
spectra |
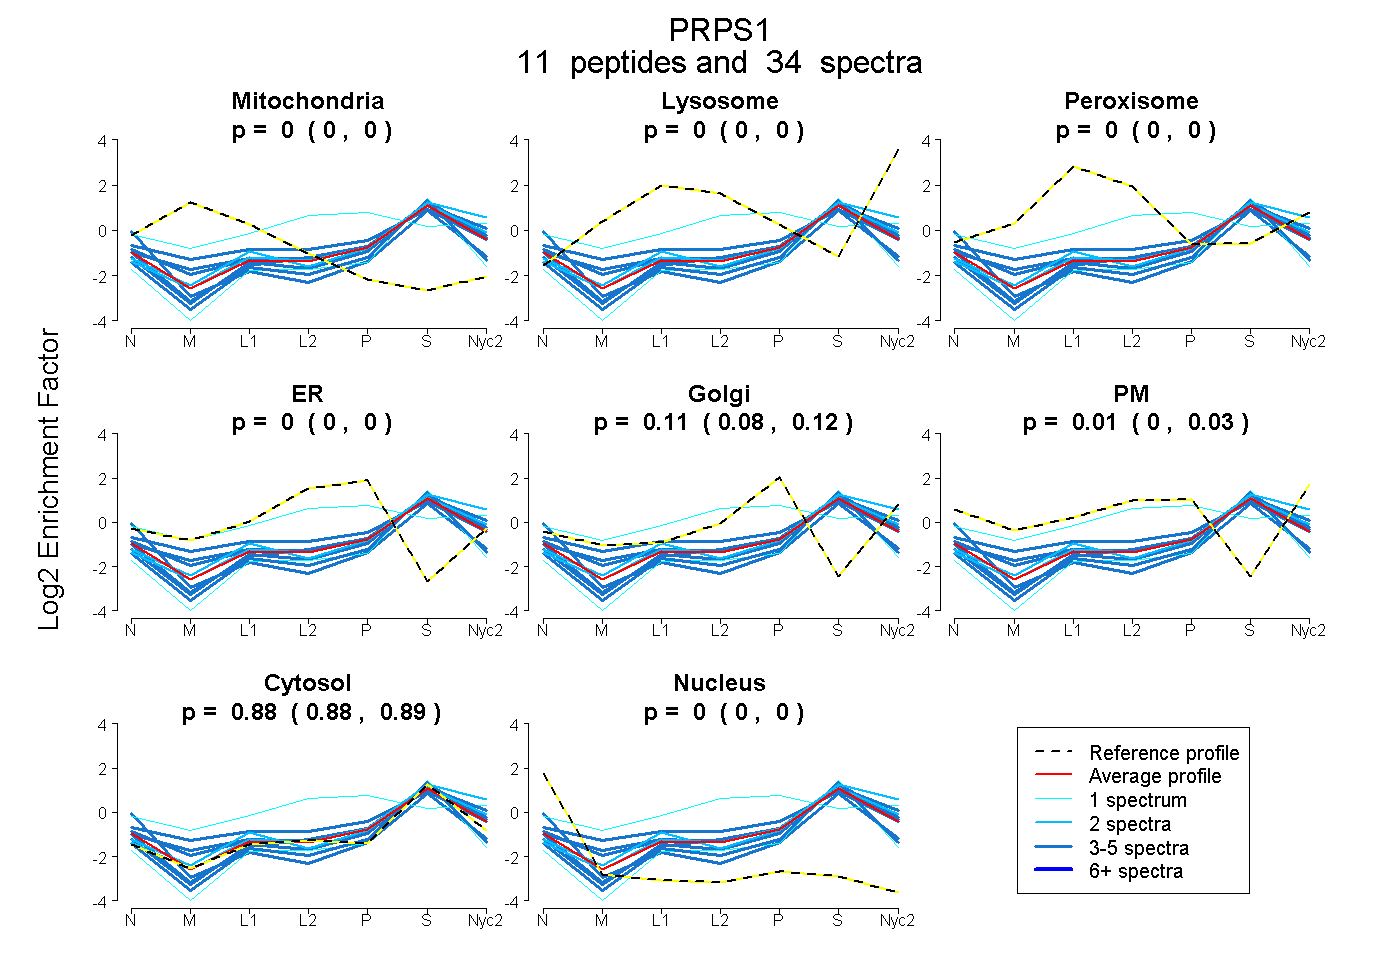 |
0.000
0.000 | 0.000 |
0.000
0.000 | 0.000 |
|
0.000
0.000 | 0.000 |
0.000
0.000 | 0.000 |
0.109
0.083 | 0.120 |
0.007
0.000 | 0.027 |
0.884
0.876 | 0.891 |
0.000
0.000 | 0.000 |
|
| | | Plot |
Mito |
|
Lyso or Perox |
|
ER |
Golgi |
PM |
Cytosol |
Nucleus |
|
| Expt B |
3
peptides |
4
spectra |
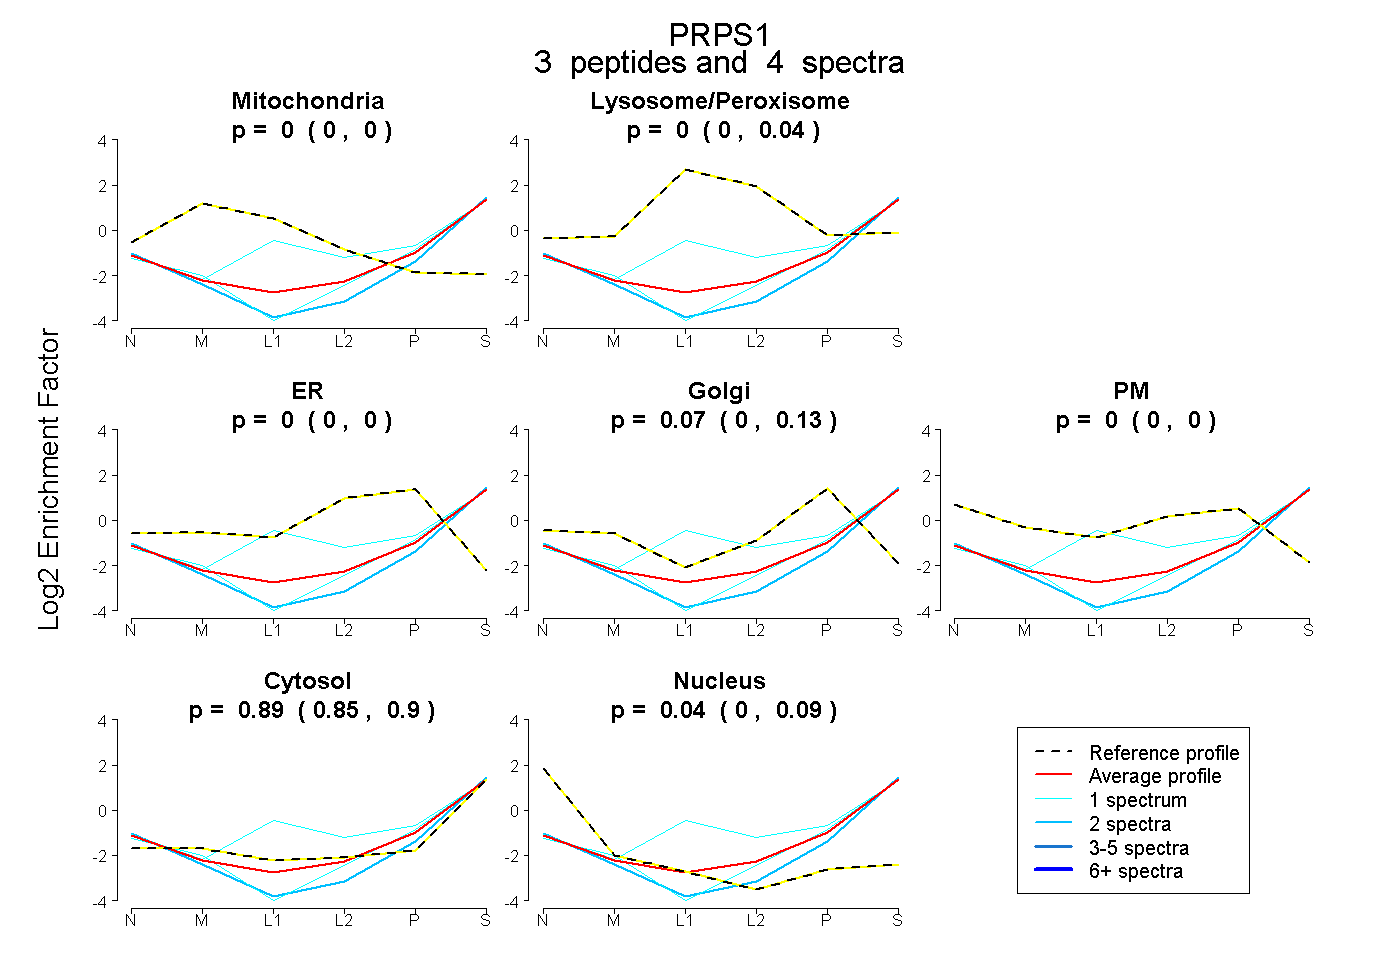 |
0.000
0.000 | 0.000 |
|
0.000
0.000 | 0.037 |
|
0.000
0.000 | 0.000 |
0.075
0.003 | 0.126 |
0.000
0.000 | 0.000 |
0.885
0.854 | 0.902 |
0.040
0.000 | 0.090 |
|
| | | Plot |
|
Lyso |
|
|
|
|
|
|
|
Other |
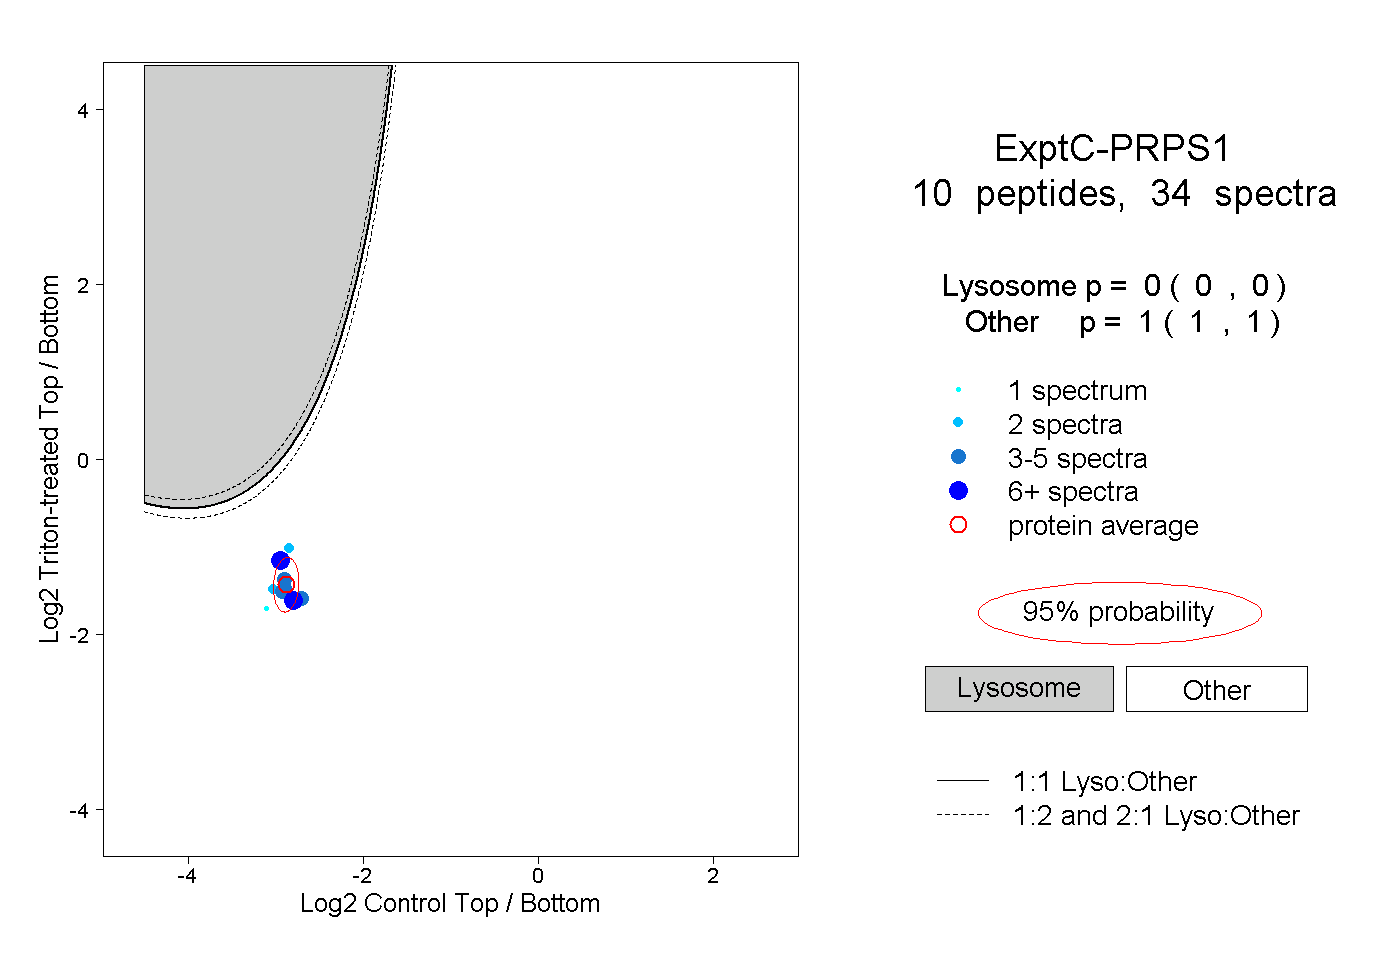
| Expt C |
10
peptides |
34
spectra |
 |
|
0.000
0.000 | 0.000 |
|
|
|
|
|
|
|
1.000
1.000 | 1.000 |
| 5 spectra, LGIEIGK |
|
0.000 |
|
|
|
|
|
|
|
1.000 |
| 4 spectra, VTSIADR |
|
0.000 |
|
|
|
|
|
|
|
1.000 |
| 6 spectra, LLSAGATR |
|
0.000 |
|
|
|
|
|
|
|
1.000 |
| 2 spectra, ENISEWK |
|
0.000 |
|
|
|
|
|
|
|
1.000 |
| 7 spectra, VTAVIPCFPYAR |
|
0.000 |
|
|
|
|
|
|
|
1.000 |
| 1 spectrum, ENISEWR |
|
0.000 |
|
|
|
|
|
|
|
1.000 |
| 2 spectra, LASASR |
|
0.000 |
|
|
|
|
|
|
|
1.000 |
| 1 spectrum, APMSAK |
|
0.000 |
|
|
|
|
|
|
|
1.000 |
| 3 spectra, LNVDFALIHK |
|
0.000 |
|
|
|
|
|
|
|
1.000 |
| 3 spectra, MVLVGDVK |
|
0.000 |
|
|
|
|
|
|
|
1.000 |
| | | Plot |
|
Lyso |
|
|
|
|
|
|
|
Other |
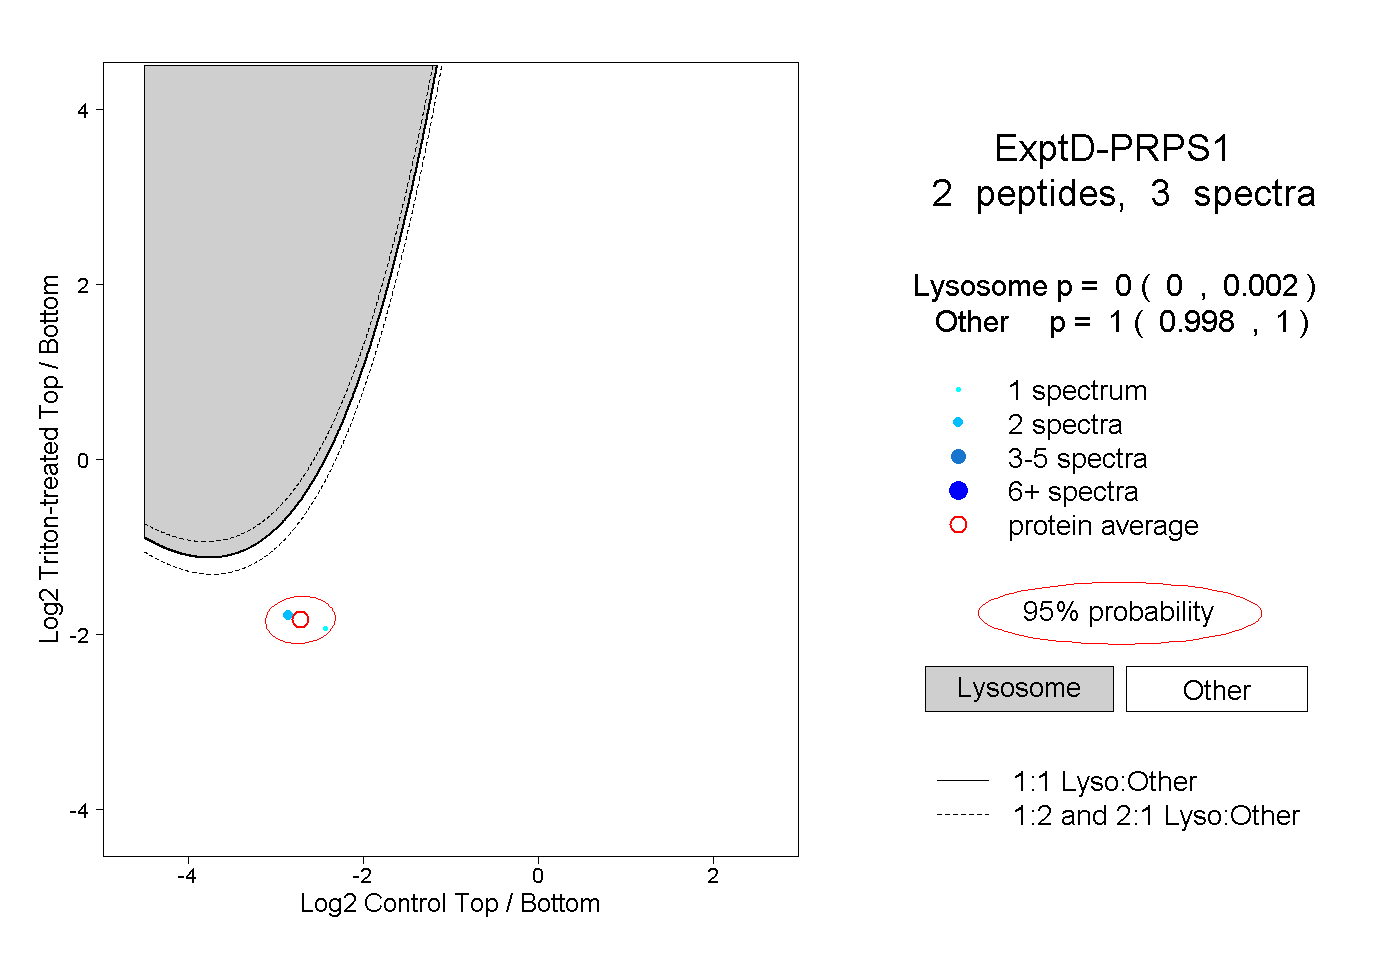
| Expt D |
2
peptides |
3
spectra |
 |
|
0.000
0.000 | 0.002 |
|
|
|
|
|
|
|
1.000
0.998 | 1.000 |