 7
7peptides
spectra
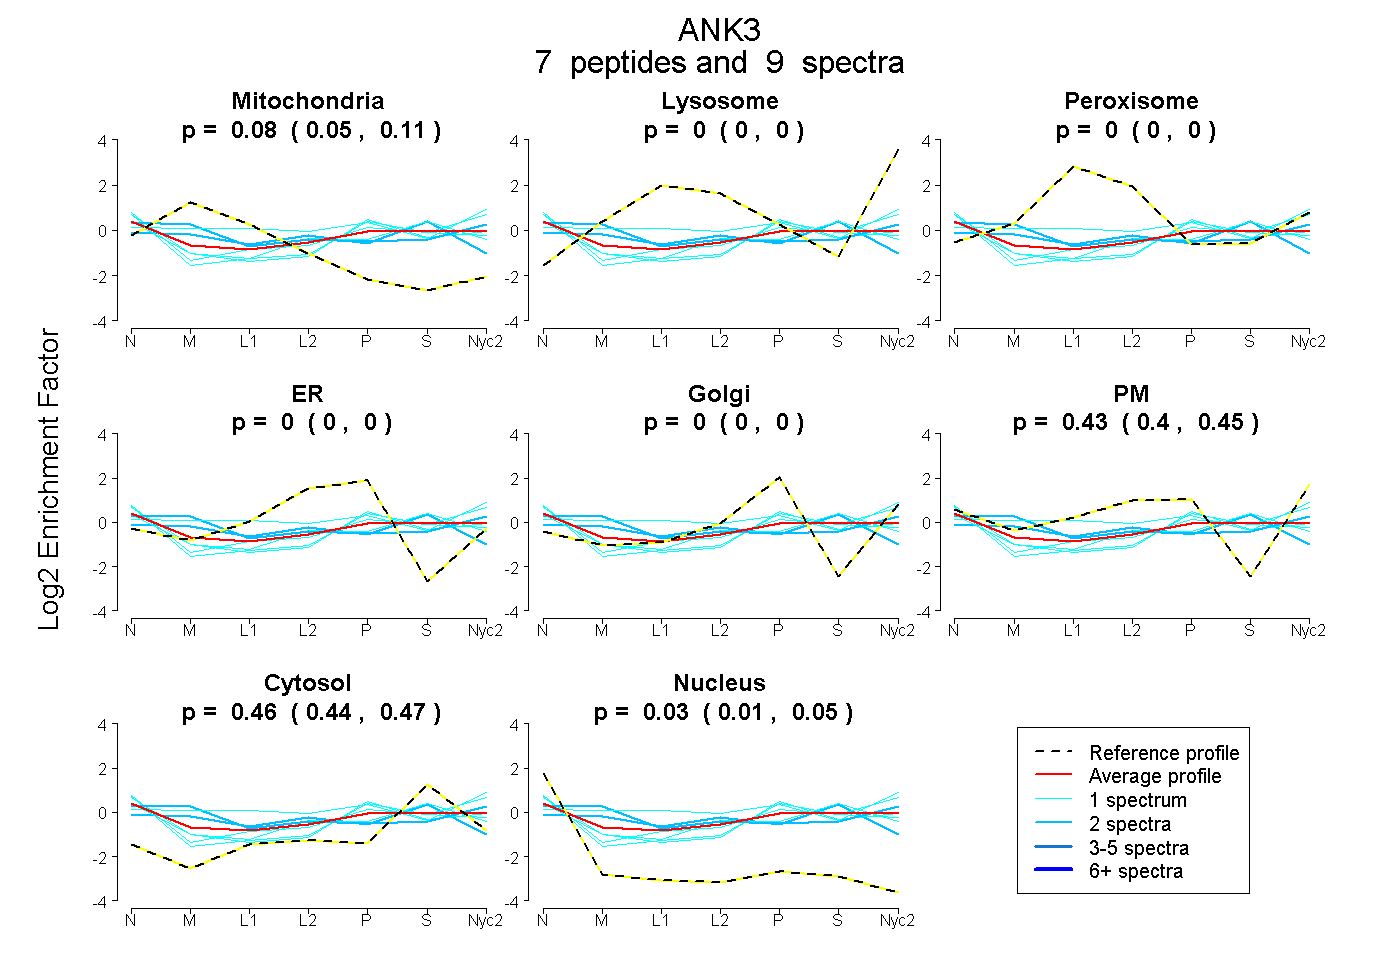
0.046 | 0.114
0.000 | 0.000
0.000 | 0.000
0.000 | 0.000
0.000 | 0.000
0.403 | 0.454
0.437 | 0.471
0.008 | 0.048
1peptide
spectrum
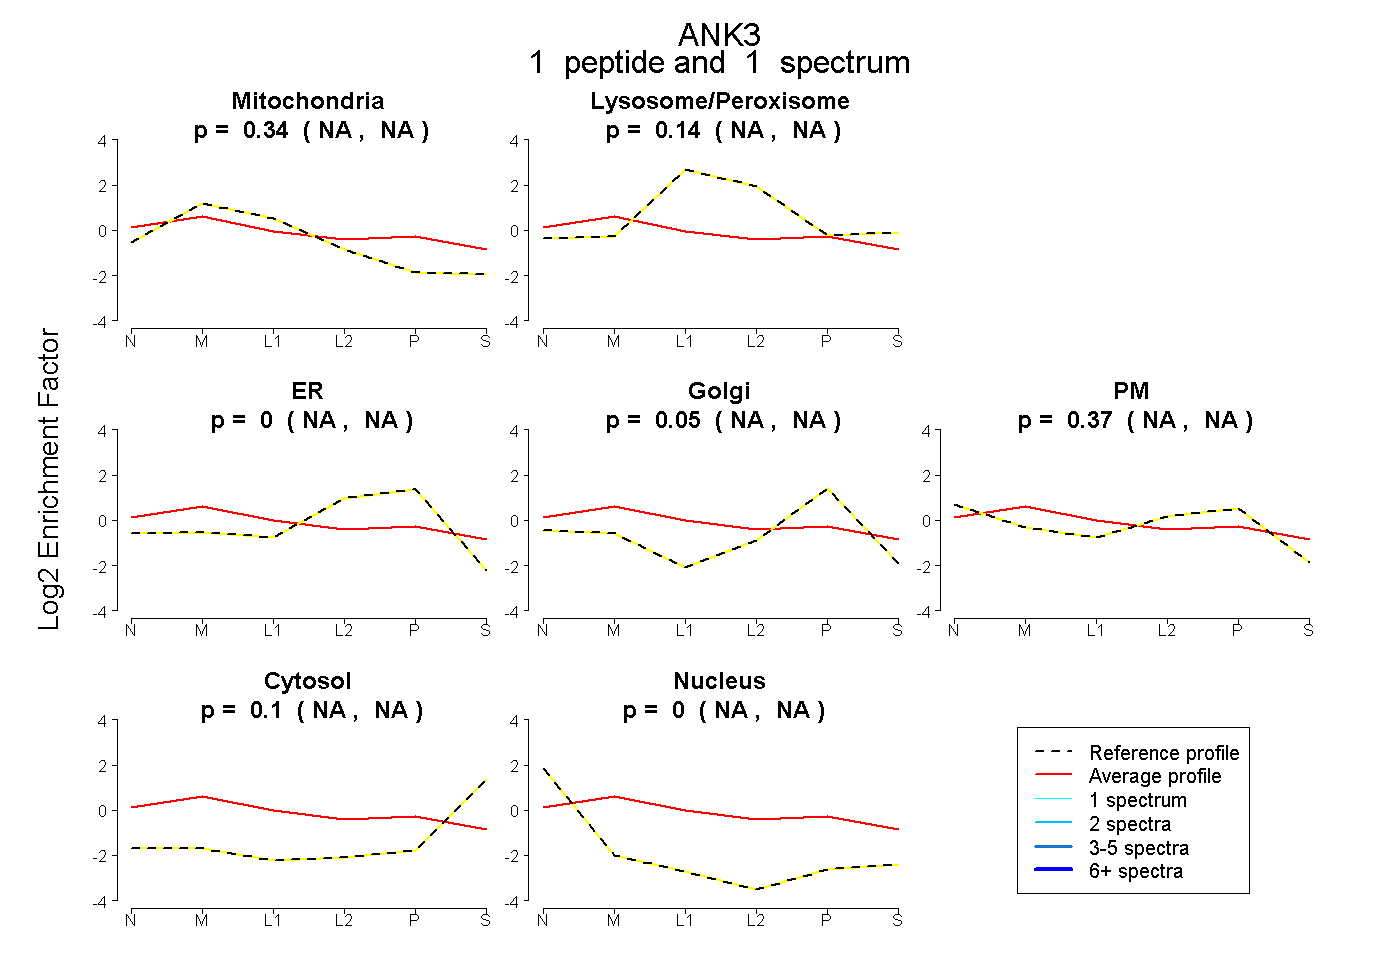
NA | NA
NA | NA
NA | NA
NA | NA
NA | NA
NA | NA
NA | NA
6peptides
spectra
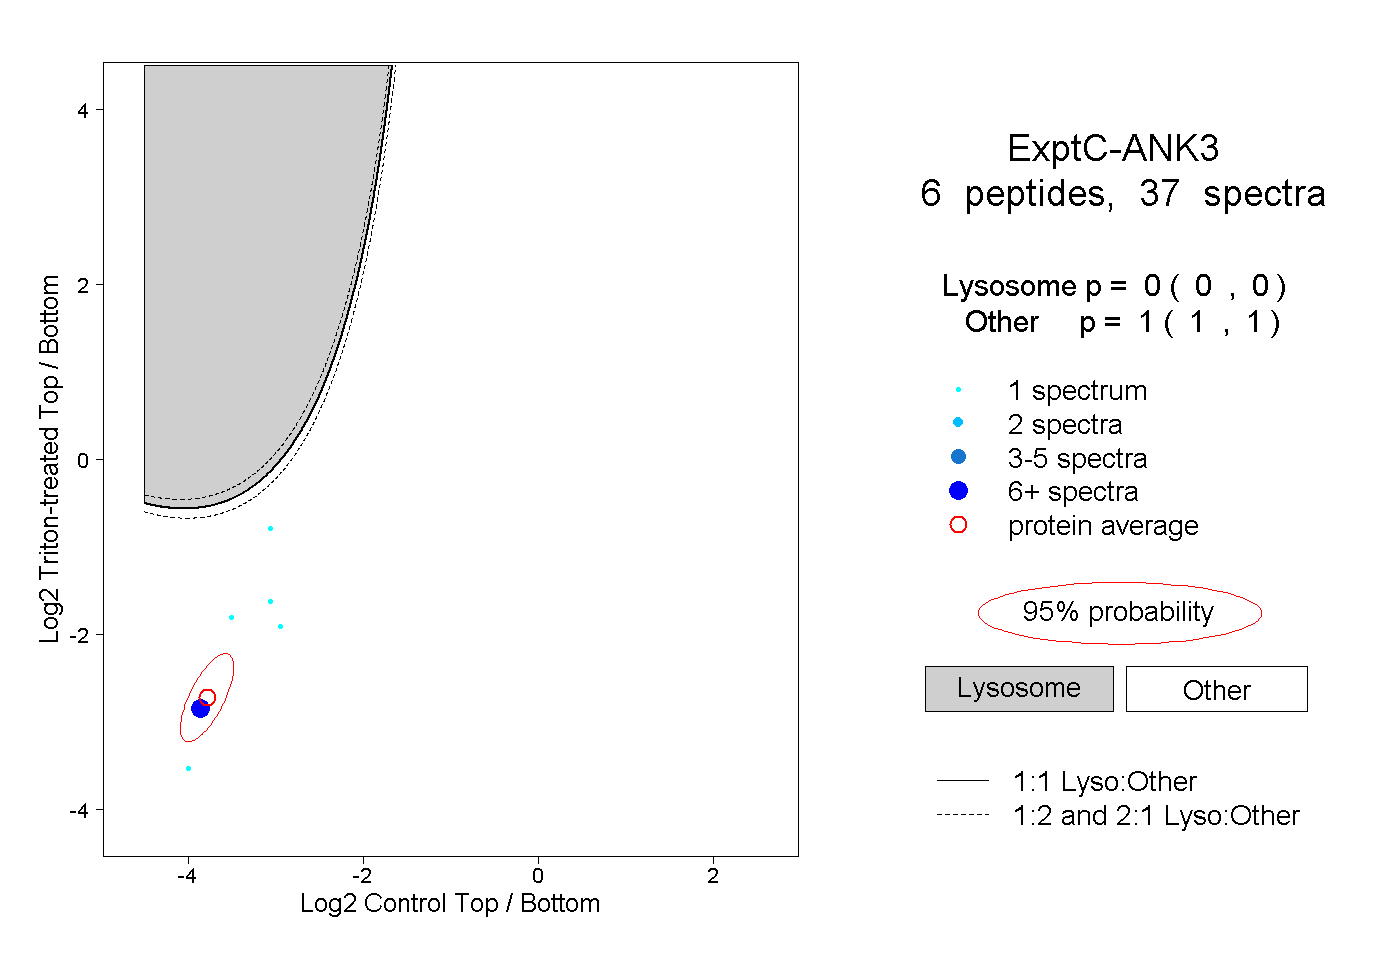
0.000 | 0.000
1.000 | 1.000
2peptides
spectra
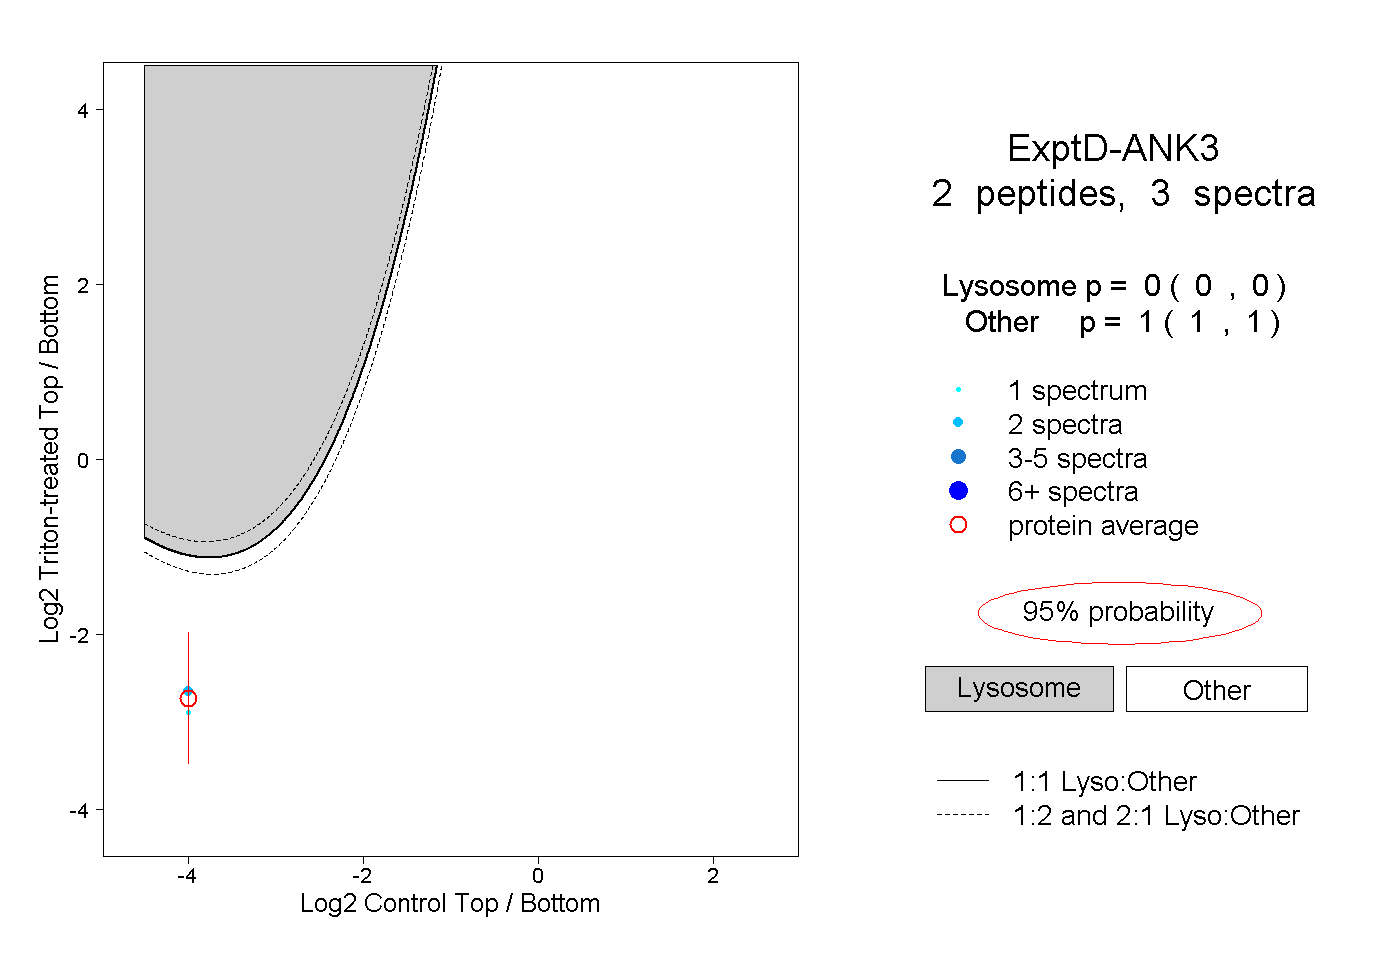
0.000 | 0.000
1.000 | 1.000