 24
24peptides
spectra
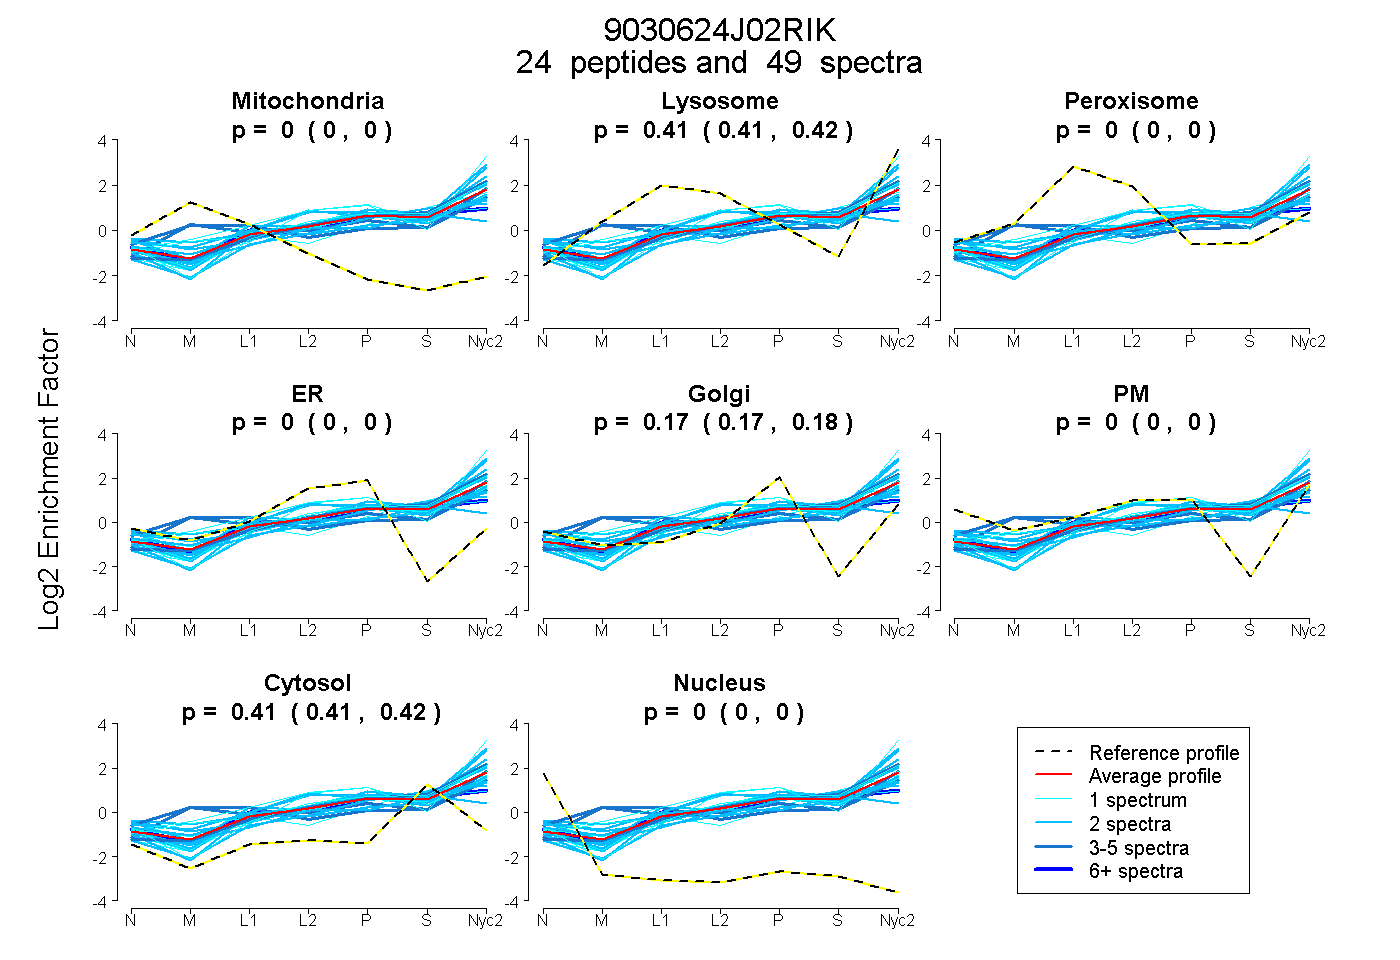
0.000 | 0.000
0.406 | 0.416
0.000 | 0.000
0.000 | 0.000
0.170 | 0.178
0.000 | 0.000
0.410 | 0.417
0.000 | 0.000
9peptides
spectra
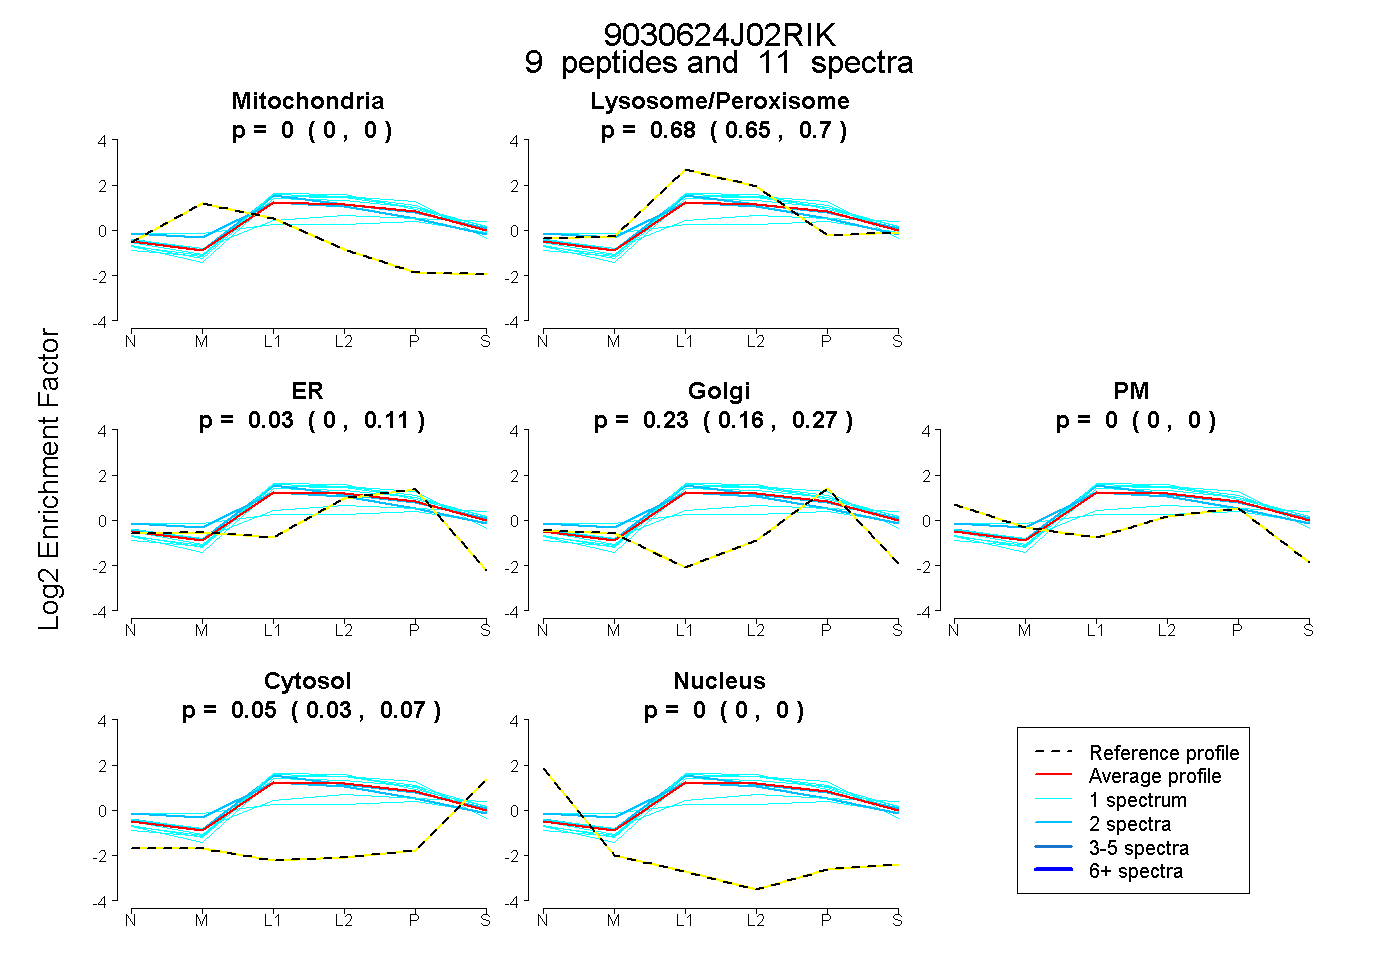
0.000 | 0.000
0.649 | 0.704
0.000 | 0.109
0.156 | 0.269
0.000 | 0.000
0.031 | 0.067
0.000 | 0.000
32peptides
spectra
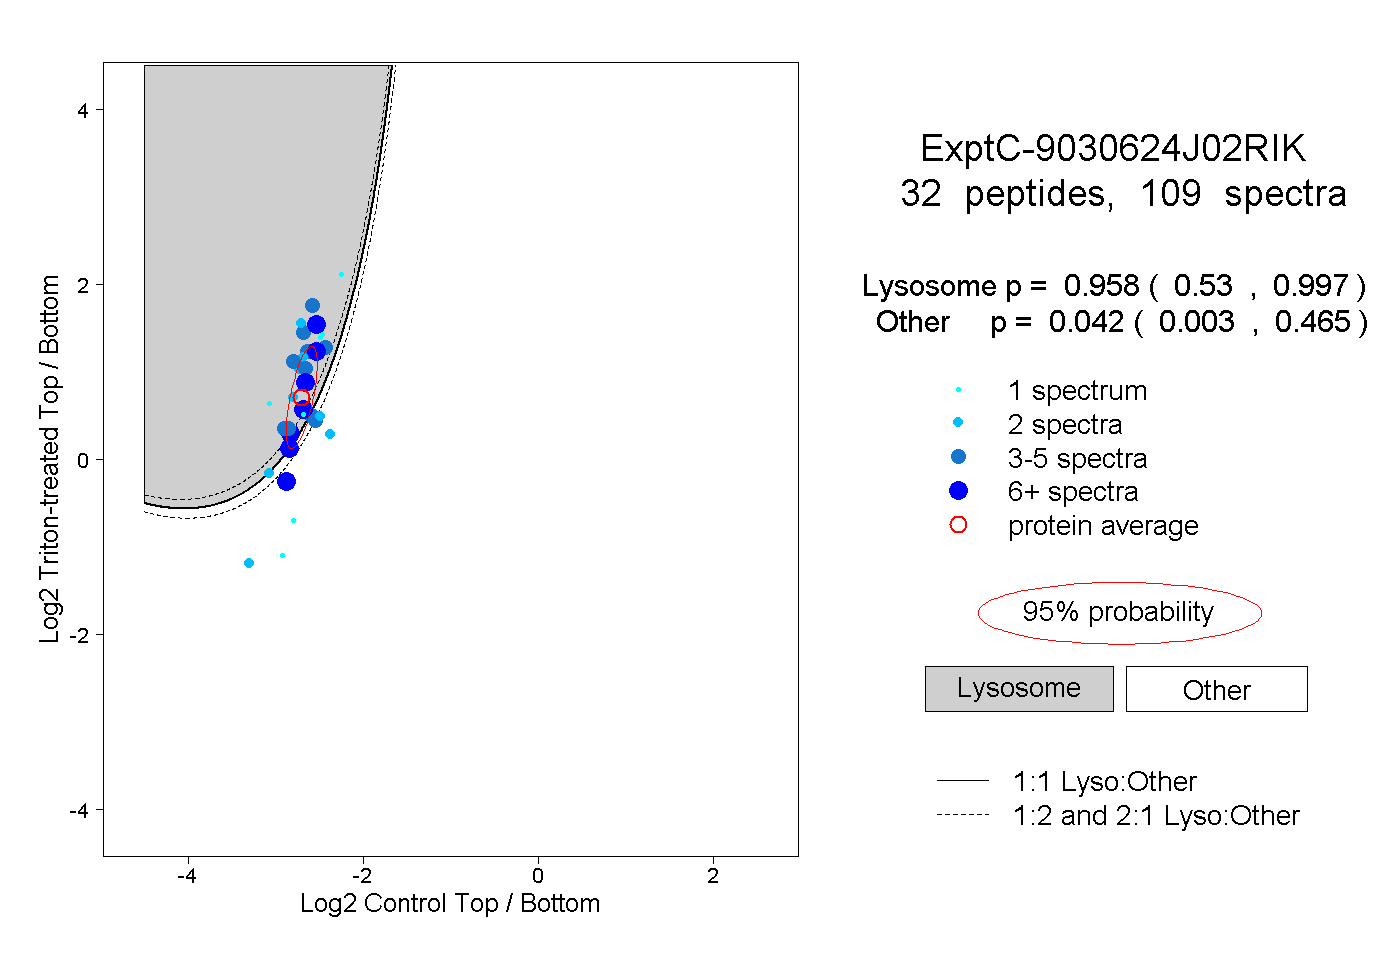
0.530 | 0.997
0.003 | 0.465
9peptides
spectra
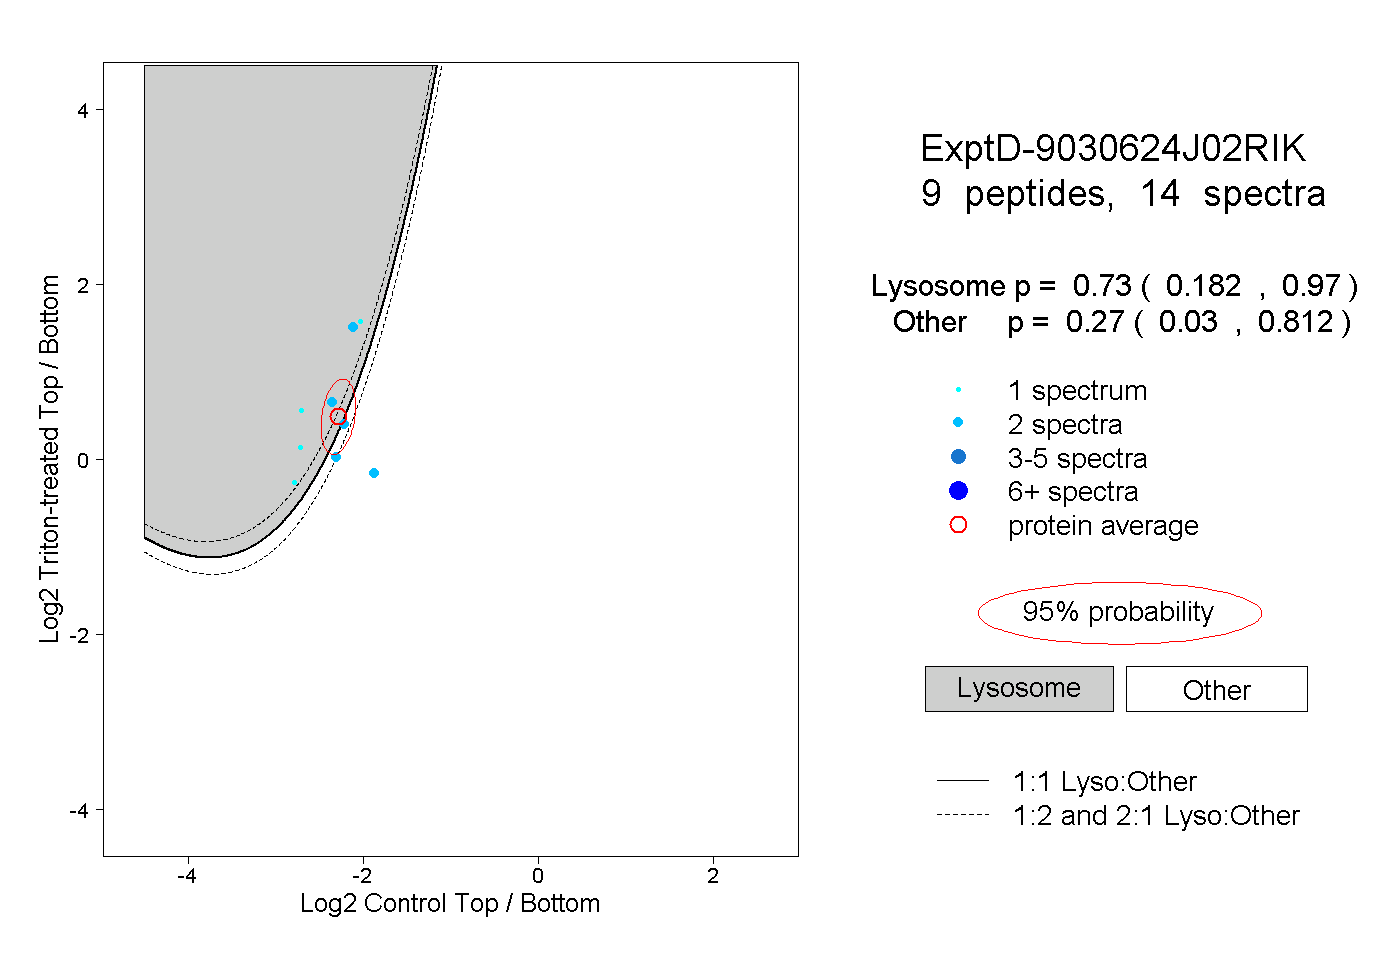
0.182 | 0.970
0.030 | 0.812