 1
1peptide
spectra
0.813 | 0.843
0.000 | 0.000
0.000 | 0.000
0.000 | 0.000
0.000 | 0.031
0.130 | 0.180
0.000 | 0.000
0.000 | 0.000
1peptide
spectra
NA | NA
NA | NA
| Plot | Mito | Lyso | Perox | ER | Golgi | PM | Cytosol | Nucleus | |||||
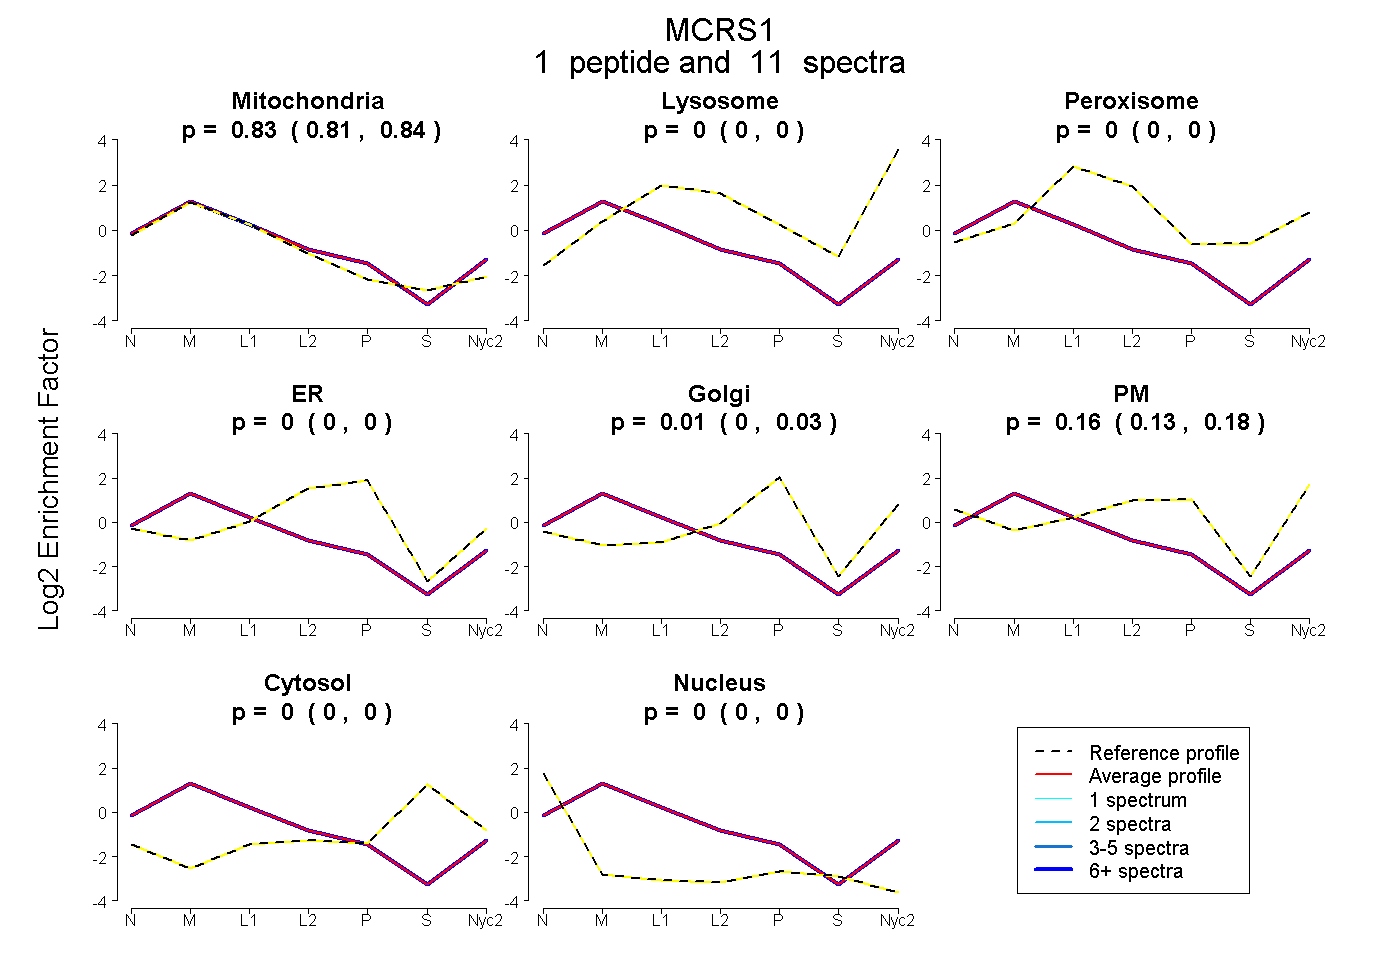
| Expt A |
1 peptide |
11 spectra |
|
0.829 0.813 | 0.843 |
0.000 0.000 | 0.000 |
0.000 0.000 | 0.000 |
0.000 0.000 | 0.000 |
0.009 0.000 | 0.031 |
0.162 0.130 | 0.180 |
0.000 0.000 | 0.000 |
0.000 0.000 | 0.000 |
||
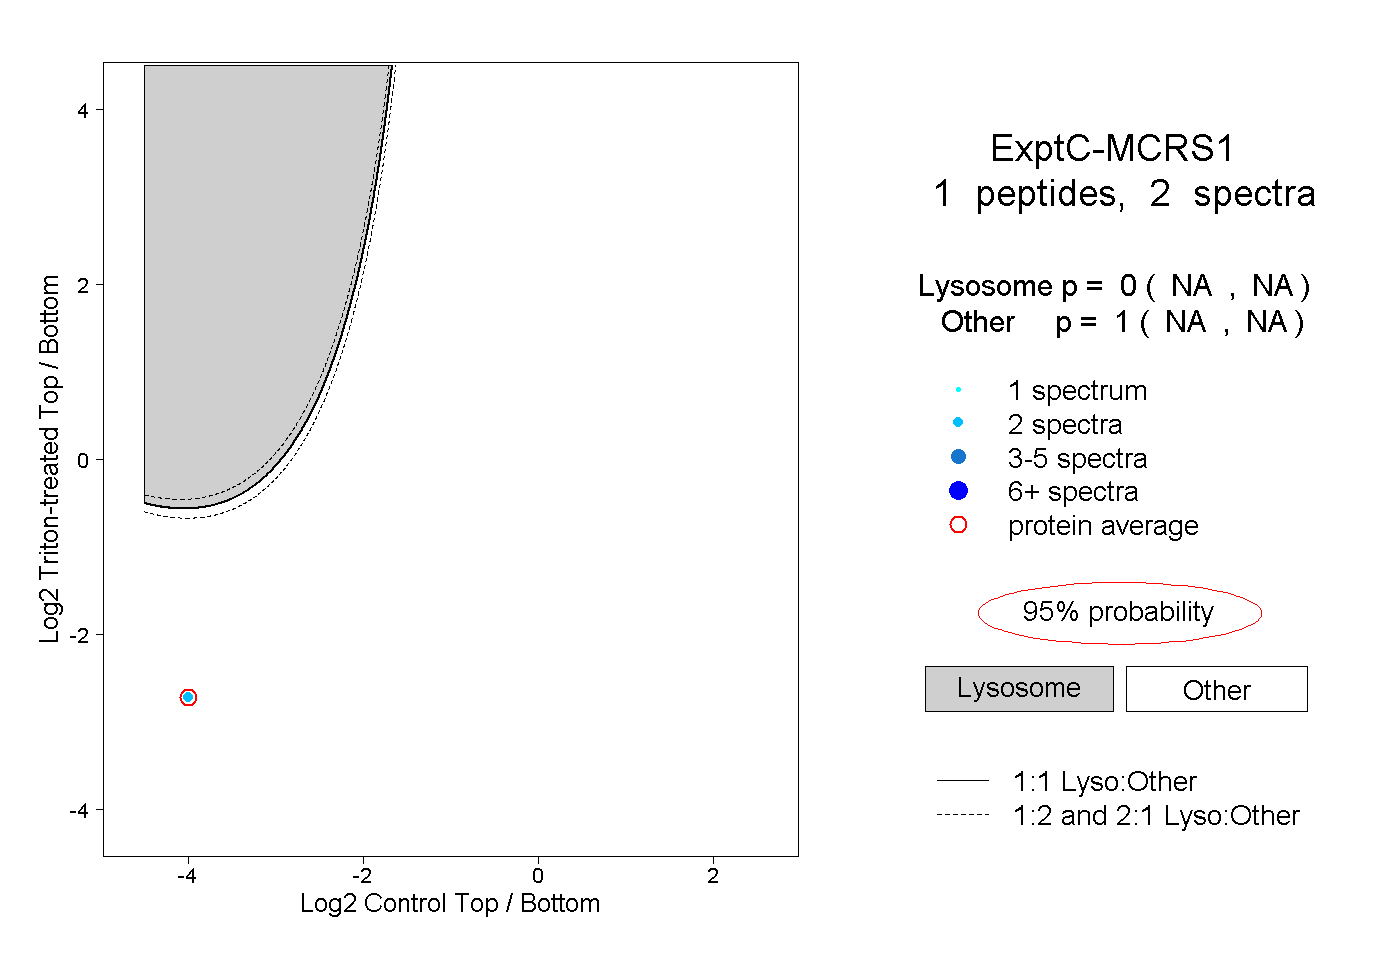
| Plot | Lyso | Other | |||||||||||
| Expt C |
1 peptide |
2 spectra |
|
0.000 NA | NA |
1.000 NA | NA |