 51
51peptides
spectra
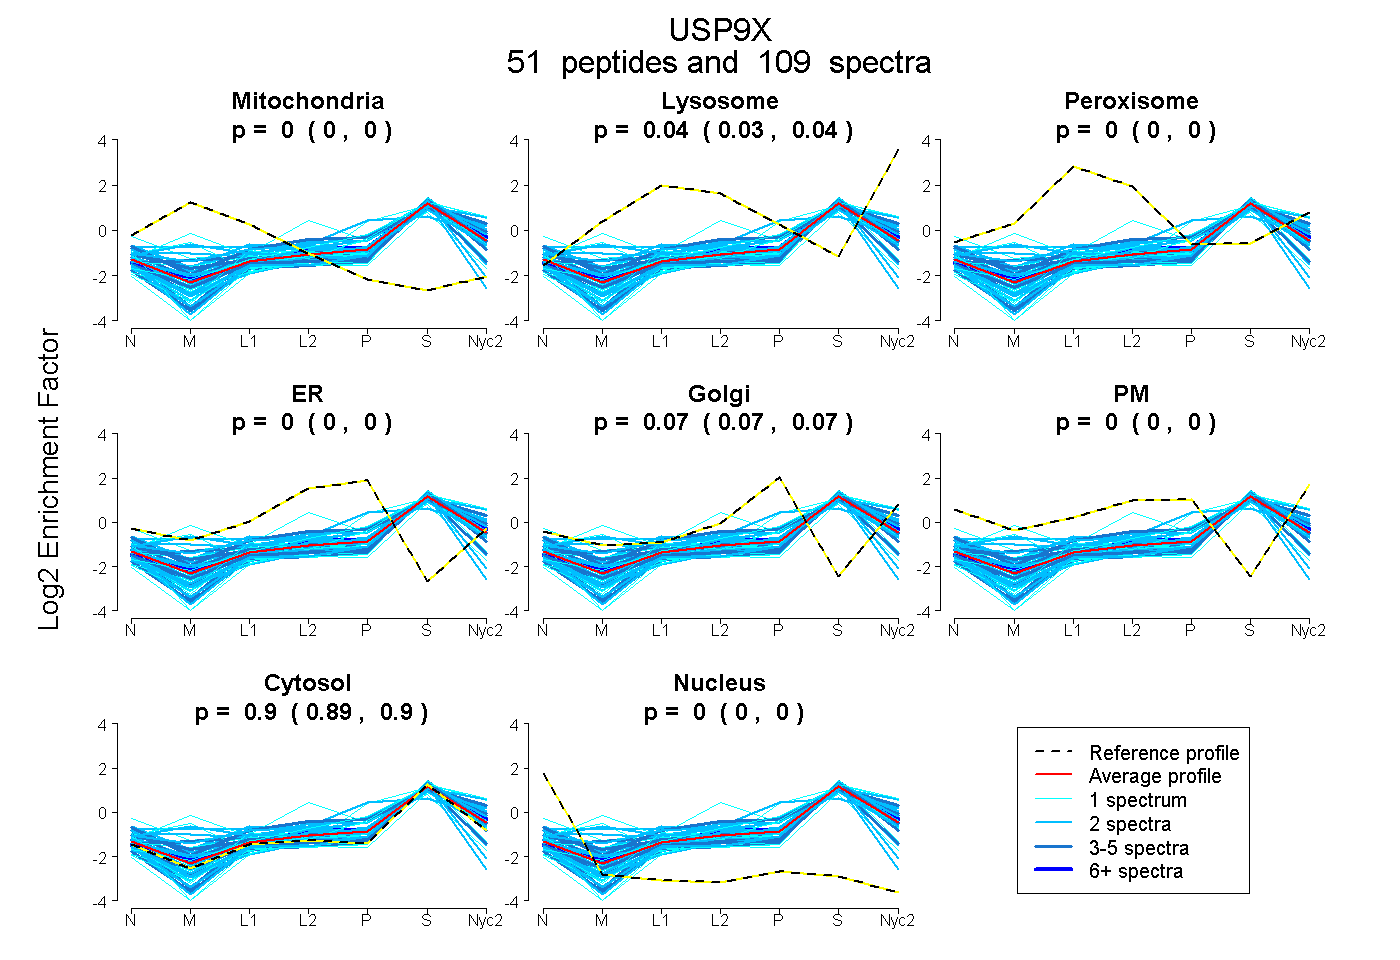
0.000 | 0.000
0.034 | 0.039
0.000 | 0.000
0.000 | 0.000
0.066 | 0.070
0.000 | 0.000
0.893 | 0.897
0.000 | 0.000
12peptides
spectra

0.000 | 0.000
0.154 | 0.201
0.000 | 0.000
0.044 | 0.115
0.000 | 0.072
0.687 | 0.715
0.000 | 0.000
38peptides
spectra
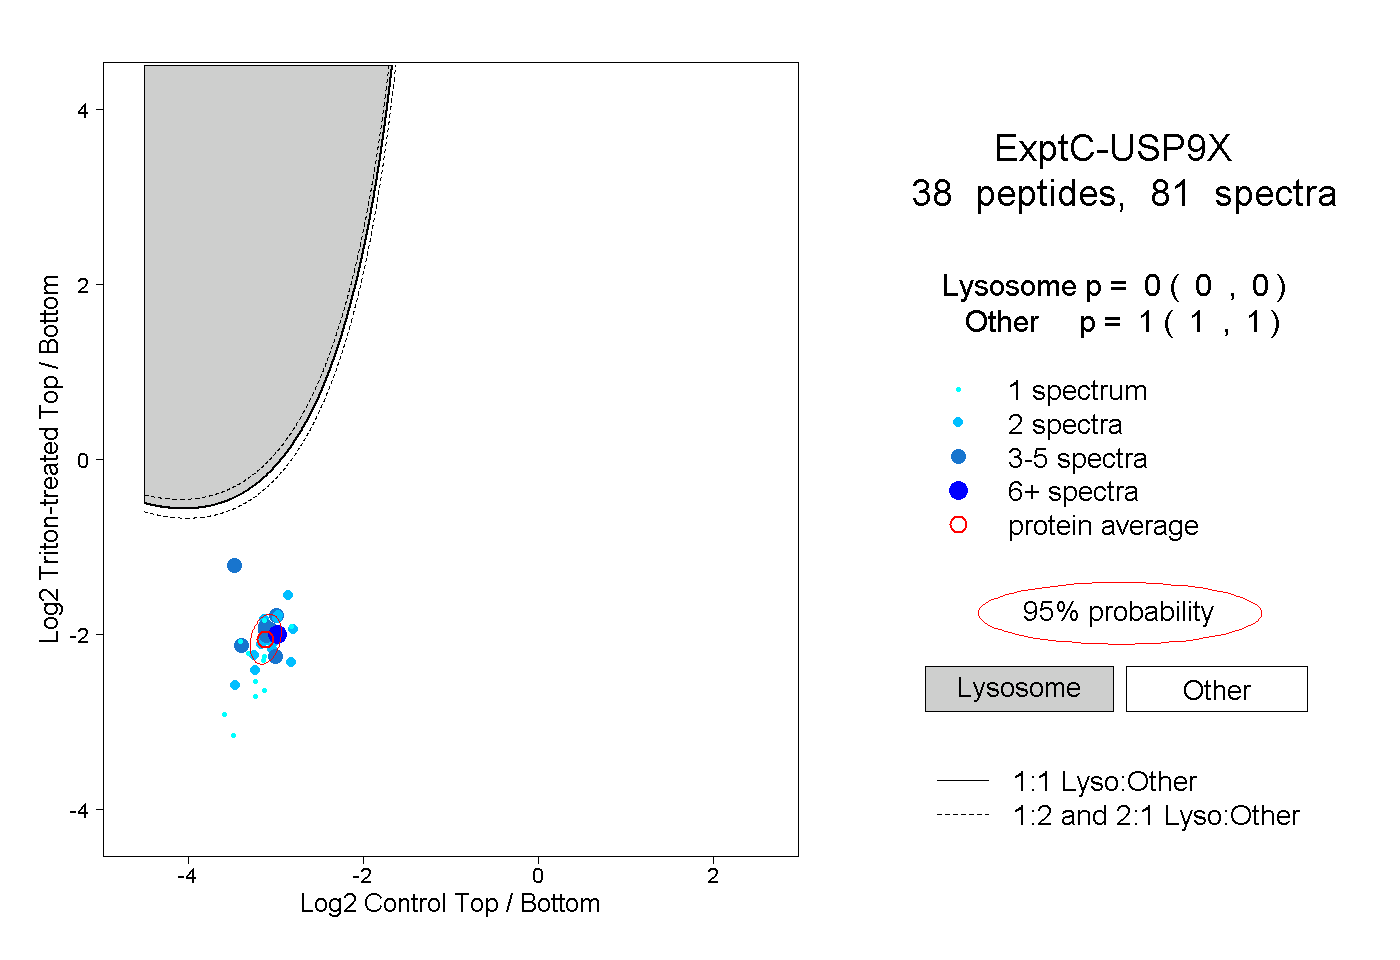
0.000 | 0.000
1.000 | 1.000
5peptides
spectra
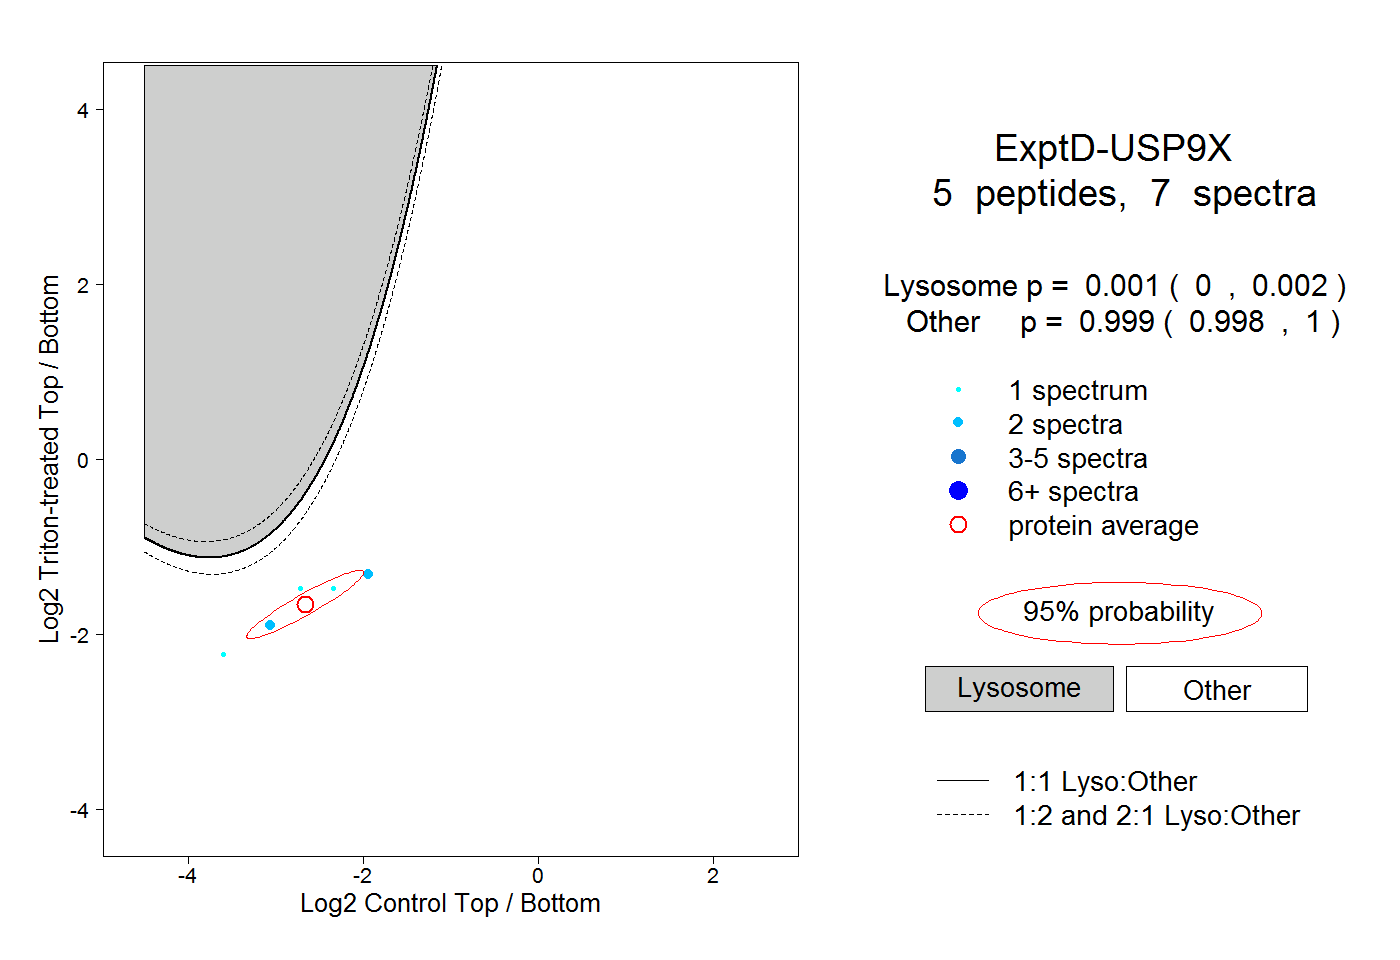
0.000 | 0.002
0.998 | 1.000