 9
9peptides
spectra
0.000 | 0.000
0.000 | 0.000
0.000 | 0.000
0.000 | 0.010
0.056 | 0.106
0.253 | 0.306
0.385 | 0.406
0.226 | 0.245
6peptides
spectra
0.000 | 0.000
1.000 | 1.000
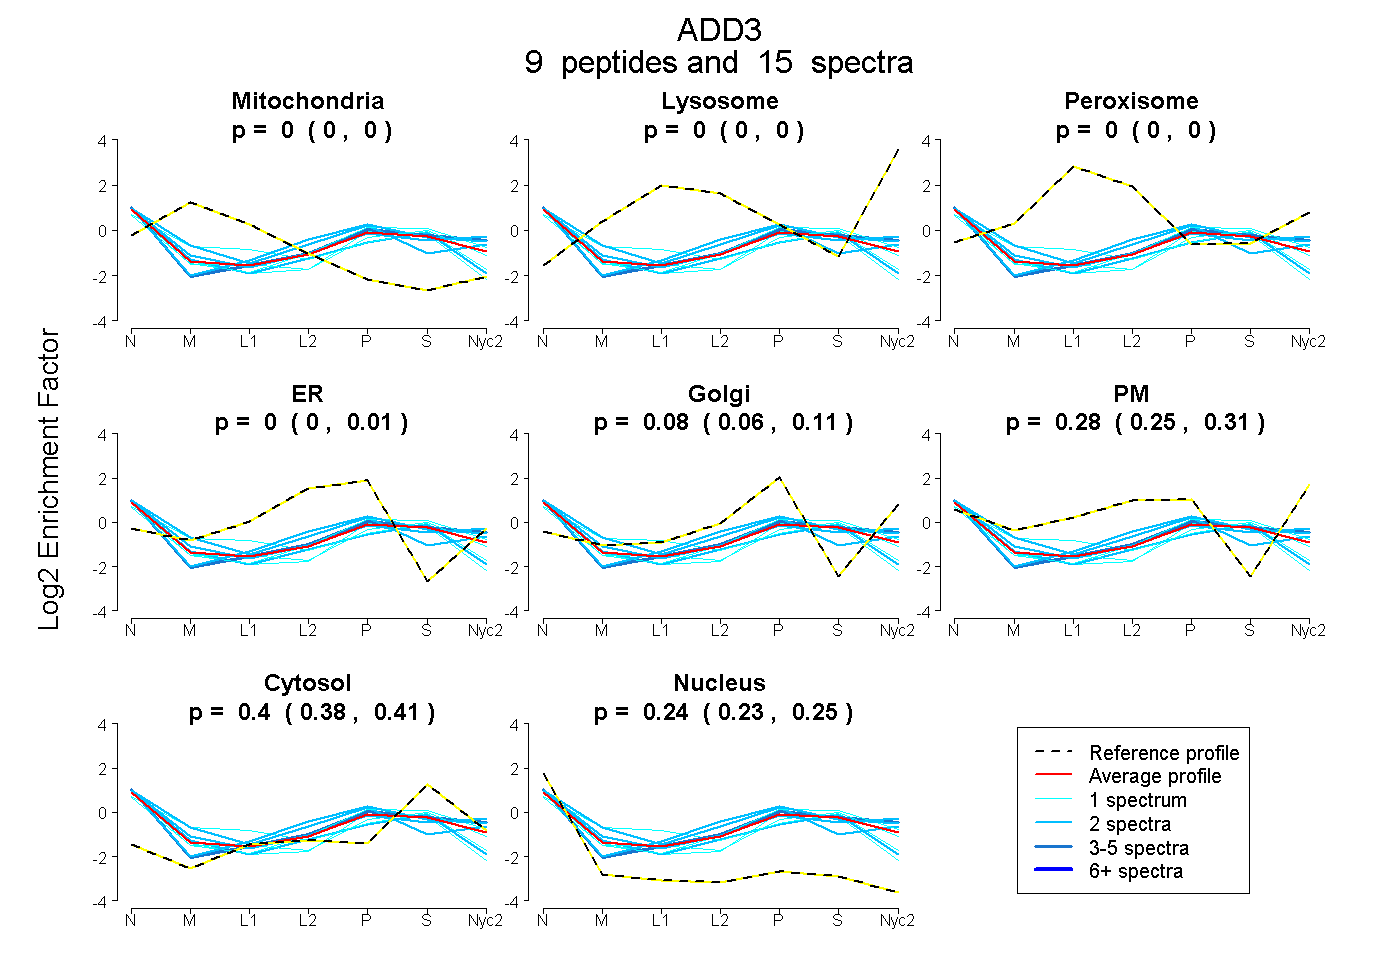
| Plot | Mito | Lyso | Perox | ER | Golgi | PM | Cytosol | Nucleus | |||||
| Expt A |
9 peptides |
15 spectra |
|
0.000 0.000 | 0.000 |
0.000 0.000 | 0.000 |
0.000 0.000 | 0.000 |
0.000 0.000 | 0.010 |
0.083 0.056 | 0.106 |
0.284 0.253 | 0.306 |
0.397 0.385 | 0.406 |
0.236 0.226 | 0.245 |
||
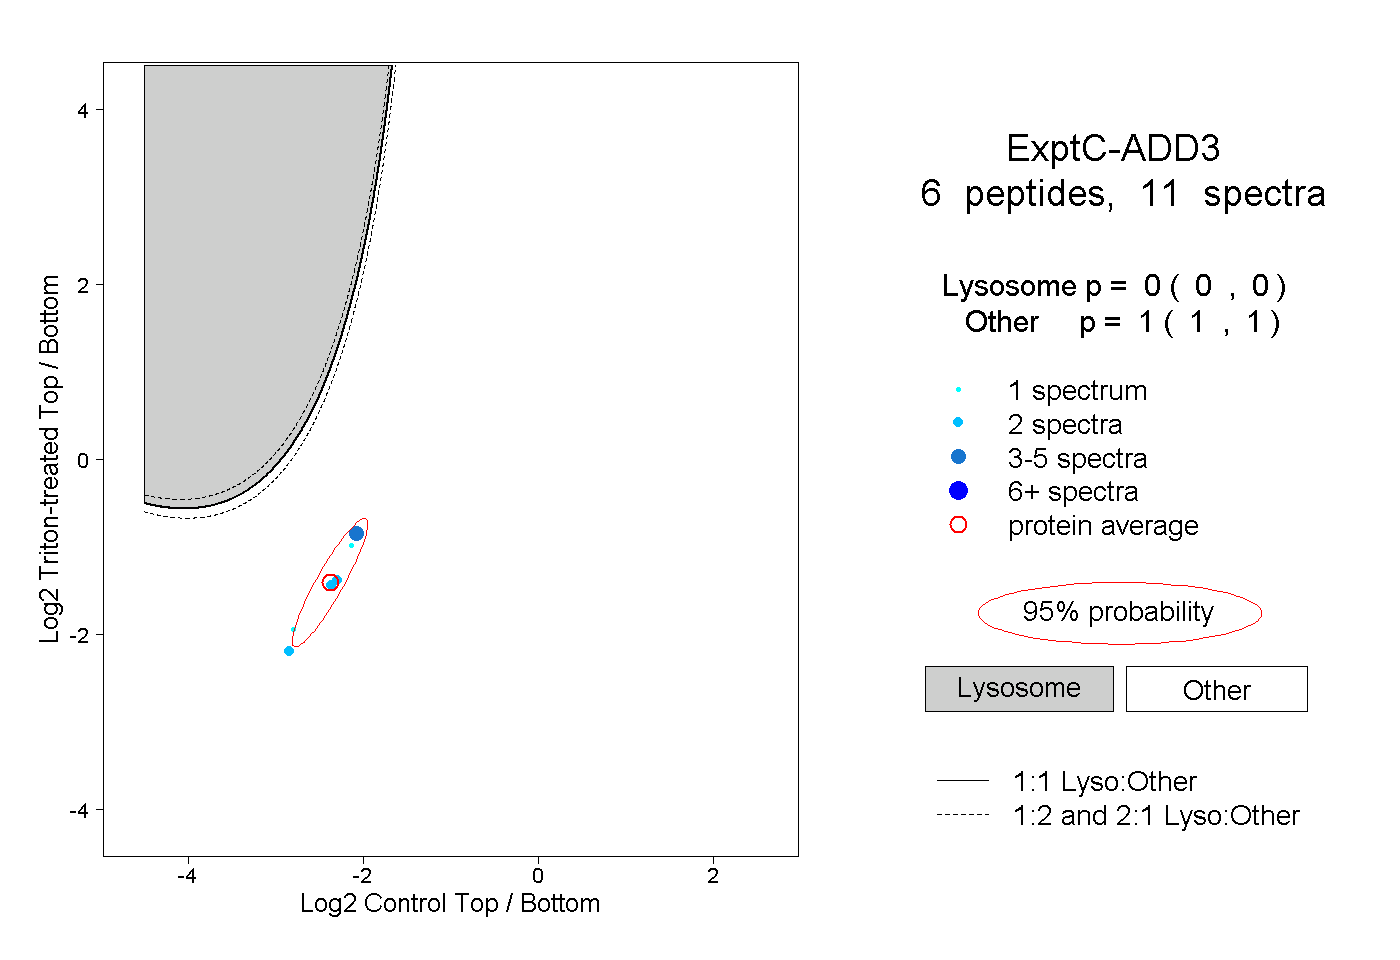
| Plot | Lyso | Other | |||||||||||
| Expt C |
6 peptides |
11 spectra |
|
0.000 0.000 | 0.000 |
1.000 1.000 | 1.000 |