 4
4peptides
spectra
0.000 | 0.000
0.000 | 0.000
0.000 | 0.000
0.000 | 0.220
0.282 | 0.555
0.000 | 0.000
0.329 | 0.472
0.006 | 0.095
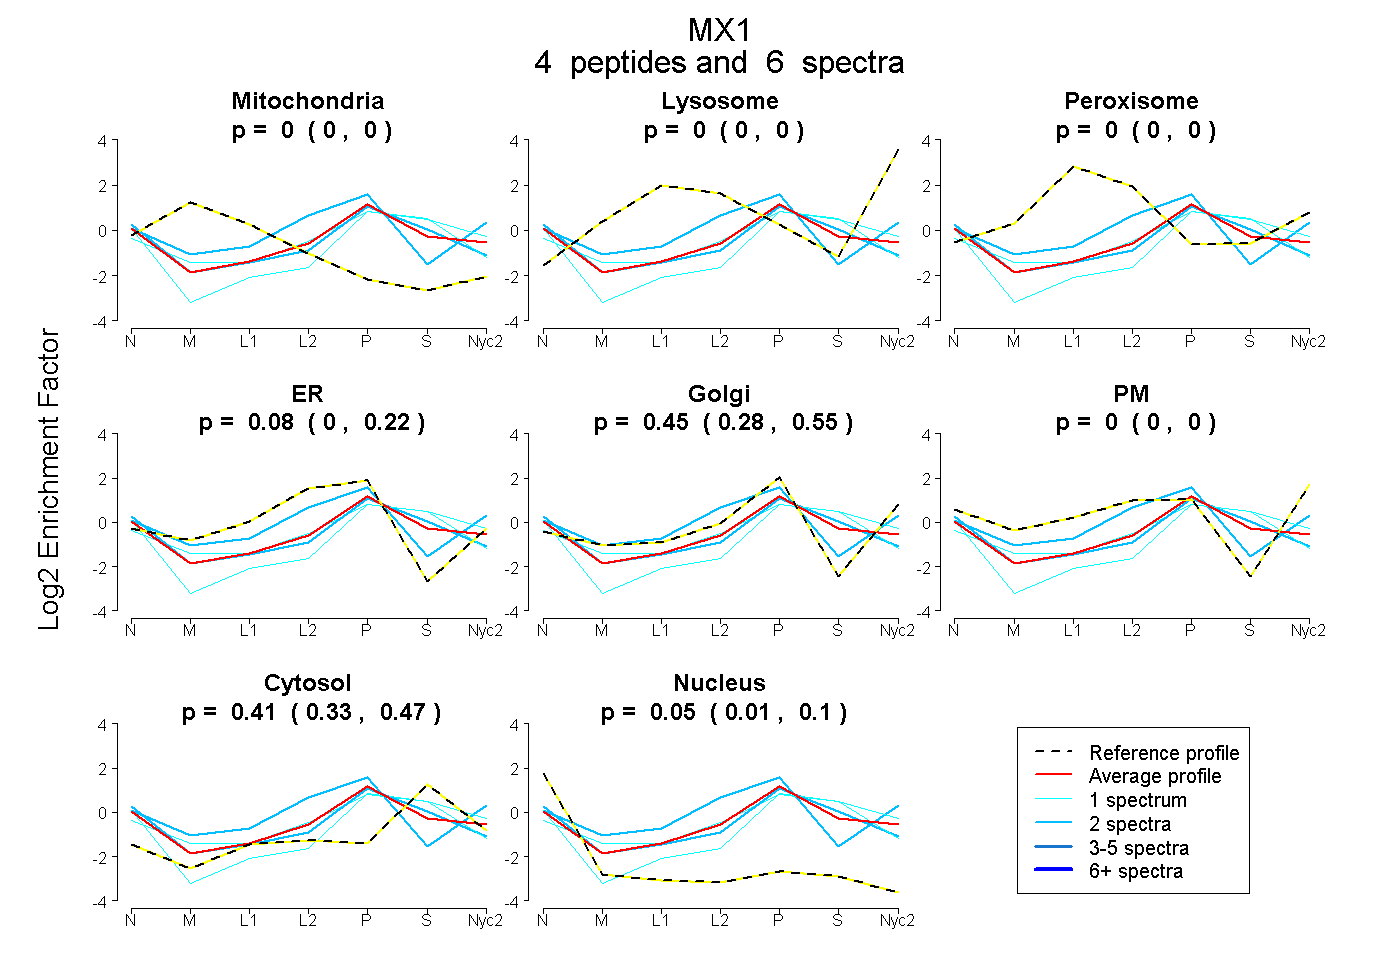
| Plot | Mito | Lyso | Perox | ER | Golgi | PM | Cytosol | Nucleus | |||||
| Expt A |
4 peptides |
6 spectra |
|
0.000 0.000 | 0.000 |
0.000 0.000 | 0.000 |
0.000 0.000 | 0.000 |
0.084 0.000 | 0.220 |
0.454 0.282 | 0.555 |
0.000 0.000 | 0.000 |
0.408 0.329 | 0.472 |
0.055 0.006 | 0.095 |
| 1 spectrum, ALEEPALNMLHR | 0.000 | 0.000 | 0.000 | 0.058 | 0.393 | 0.000 | 0.549 | 0.000 | ||
| 1 spectrum, LSFLMNK | 0.000 | 0.000 | 0.000 | 0.000 | 0.261 | 0.000 | 0.589 | 0.151 | ||
| 2 spectra, AFENIIK | 0.000 | 0.000 | 0.000 | 0.337 | 0.318 | 0.190 | 0.155 | 0.000 | ||
| 2 spectra, INVFNK | 0.000 | 0.000 | 0.000 | 0.108 | 0.341 | 0.000 | 0.448 | 0.103 |