 22
22peptides
spectra
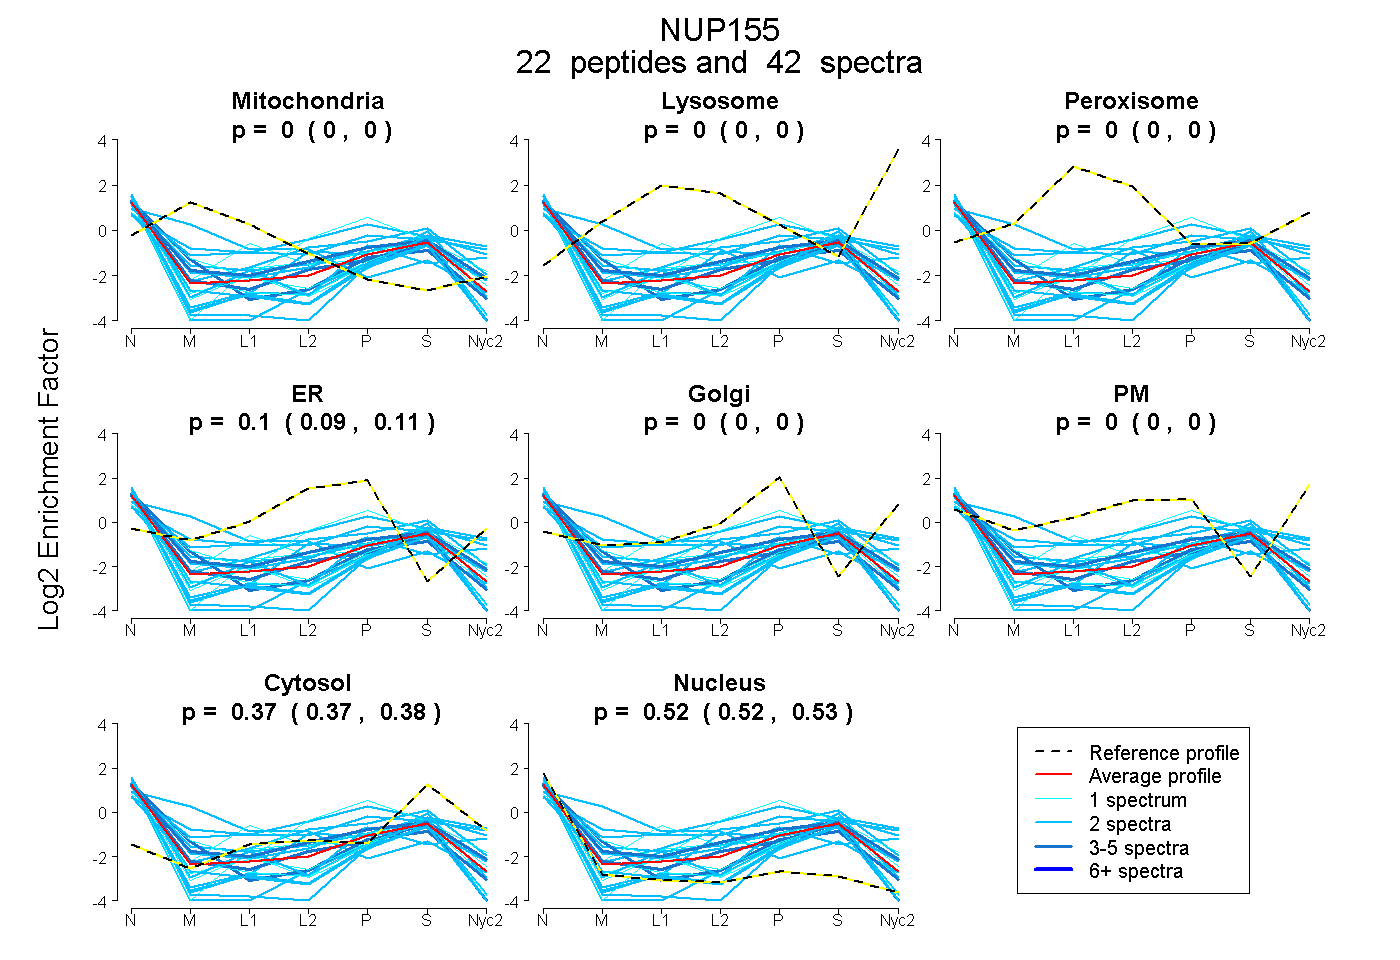
0.000 | 0.000
0.000 | 0.000
0.000 | 0.000
0.094 | 0.109
0.000 | 0.000
0.000 | 0.000
0.368 | 0.380
0.516 | 0.529
7peptides
spectra
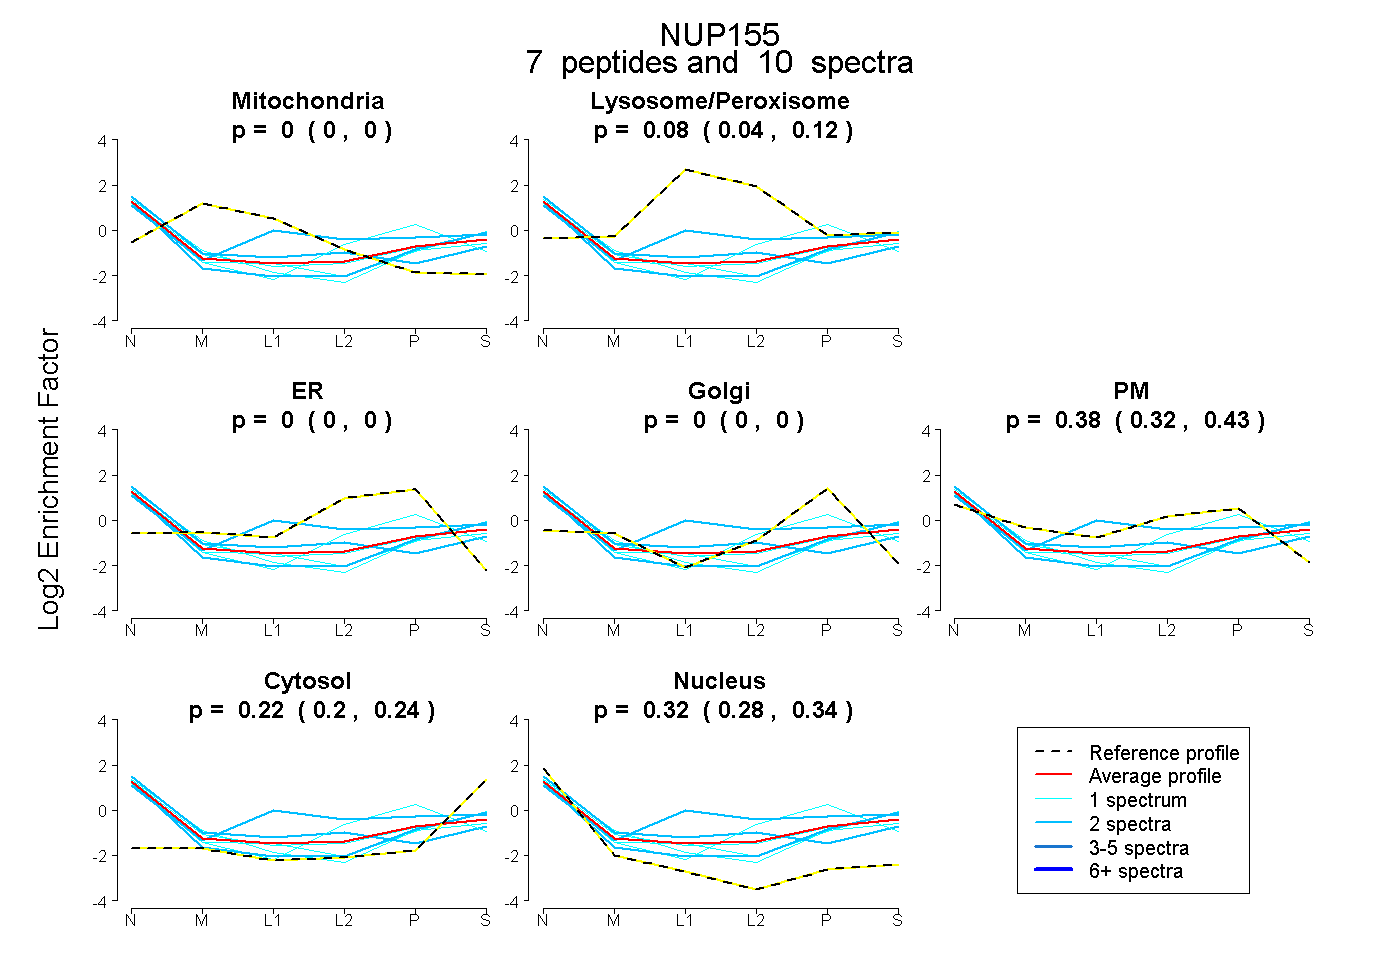
0.000 | 0.000
0.038 | 0.124
0.000 | 0.000
0.000 | 0.000
0.316 | 0.427
0.199 | 0.241
0.283 | 0.344
5peptides
spectra
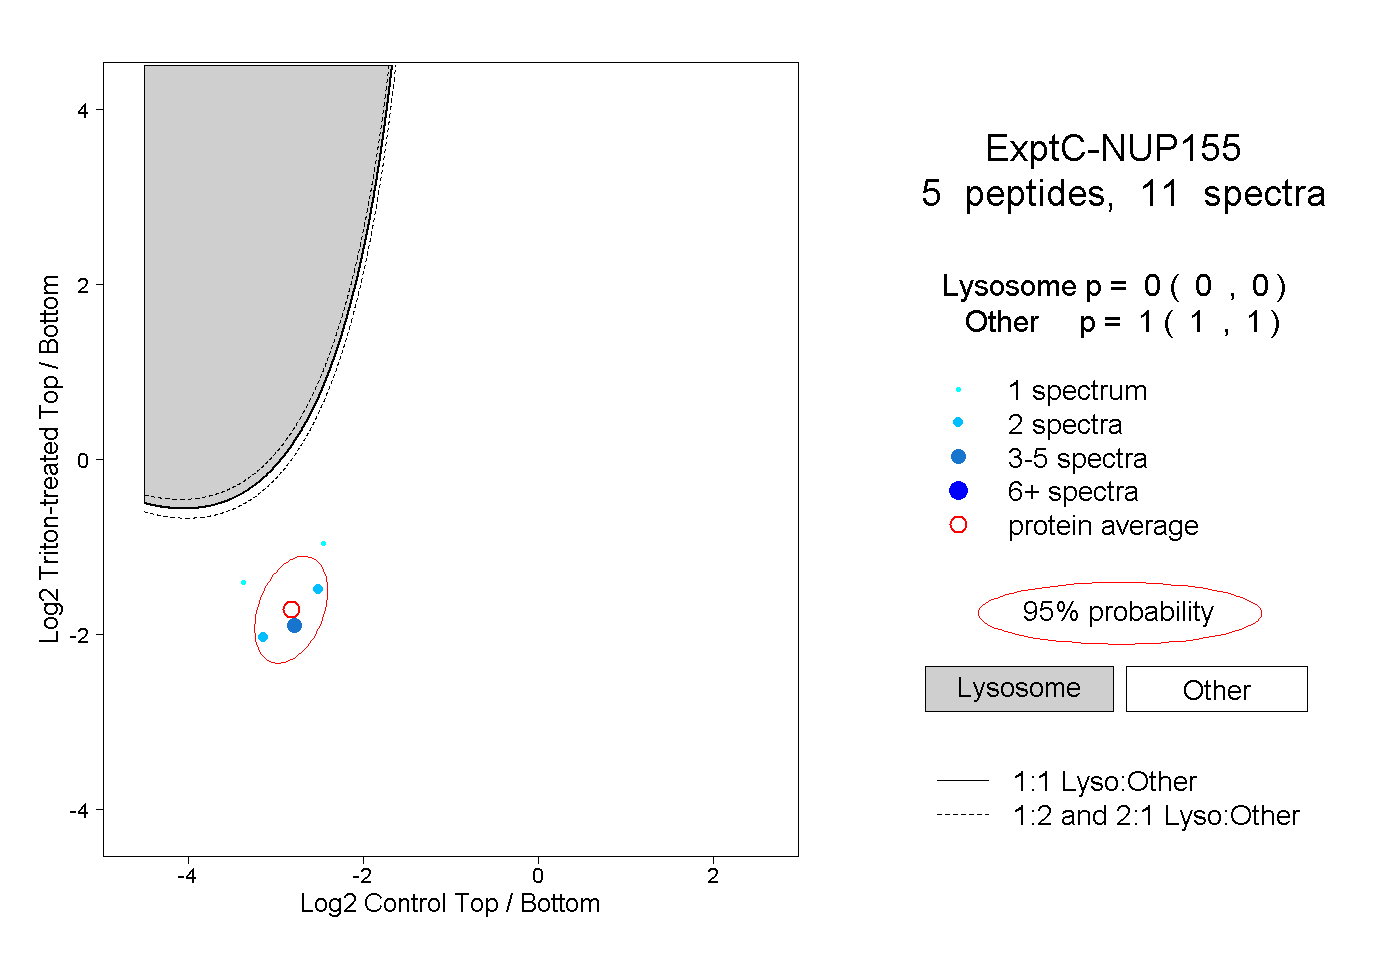
0.000 | 0.000
1.000 | 1.000