 5
5peptides
spectra
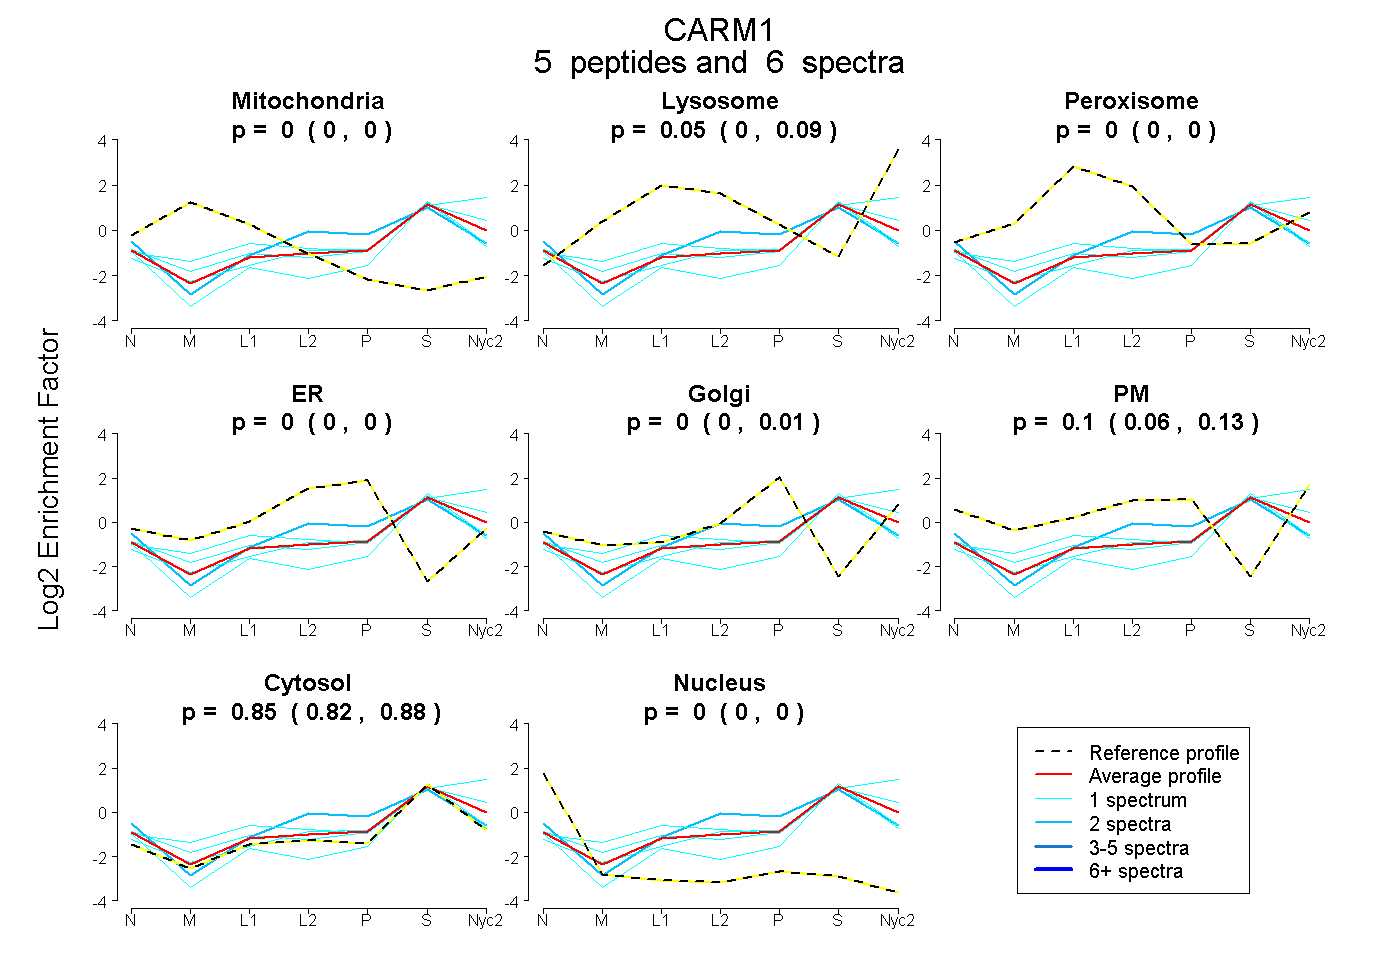
0.000 | 0.000
0.000 | 0.094
0.000 | 0.000
0.000 | 0.000
0.000 | 0.014
0.055 | 0.125
0.821 | 0.878
0.000 | 0.000
| Plot | Mito | Lyso | Perox | ER | Golgi | PM | Cytosol | Nucleus | |||||
| Expt A |
5 peptides |
6 spectra |
|
0.000 0.000 | 0.000 |
0.048 0.000 | 0.094 |
0.000 0.000 | 0.000 |
0.000 0.000 | 0.000 |
0.000 0.000 | 0.014 |
0.099 0.055 | 0.125 |
0.853 0.821 | 0.878 |
0.000 0.000 | 0.000 |
| 1 spectrum, TGTYQR | 0.000 | 0.336 | 0.000 | 0.000 | 0.000 | 0.000 | 0.664 | 0.000 | ||
| 1 spectrum, IEIPFK | 0.000 | 0.000 | 0.000 | 0.000 | 0.000 | 0.000 | 0.929 | 0.071 | ||
| 1 spectrum, GAAVDEYFR | 0.000 | 0.138 | 0.000 | 0.000 | 0.000 | 0.058 | 0.804 | 0.000 | ||
| 1 spectrum, SSNLLDLK | 0.000 | 0.000 | 0.000 | 0.064 | 0.031 | 0.000 | 0.905 | 0.000 | ||
| 2 spectra, HAEQQALR | 0.000 | 0.000 | 0.000 | 0.231 | 0.000 | 0.000 | 0.769 | 0.000 |
| Plot | Lyso | Other | |||||||||||
| Expt C |
4 peptides |
5 spectra |
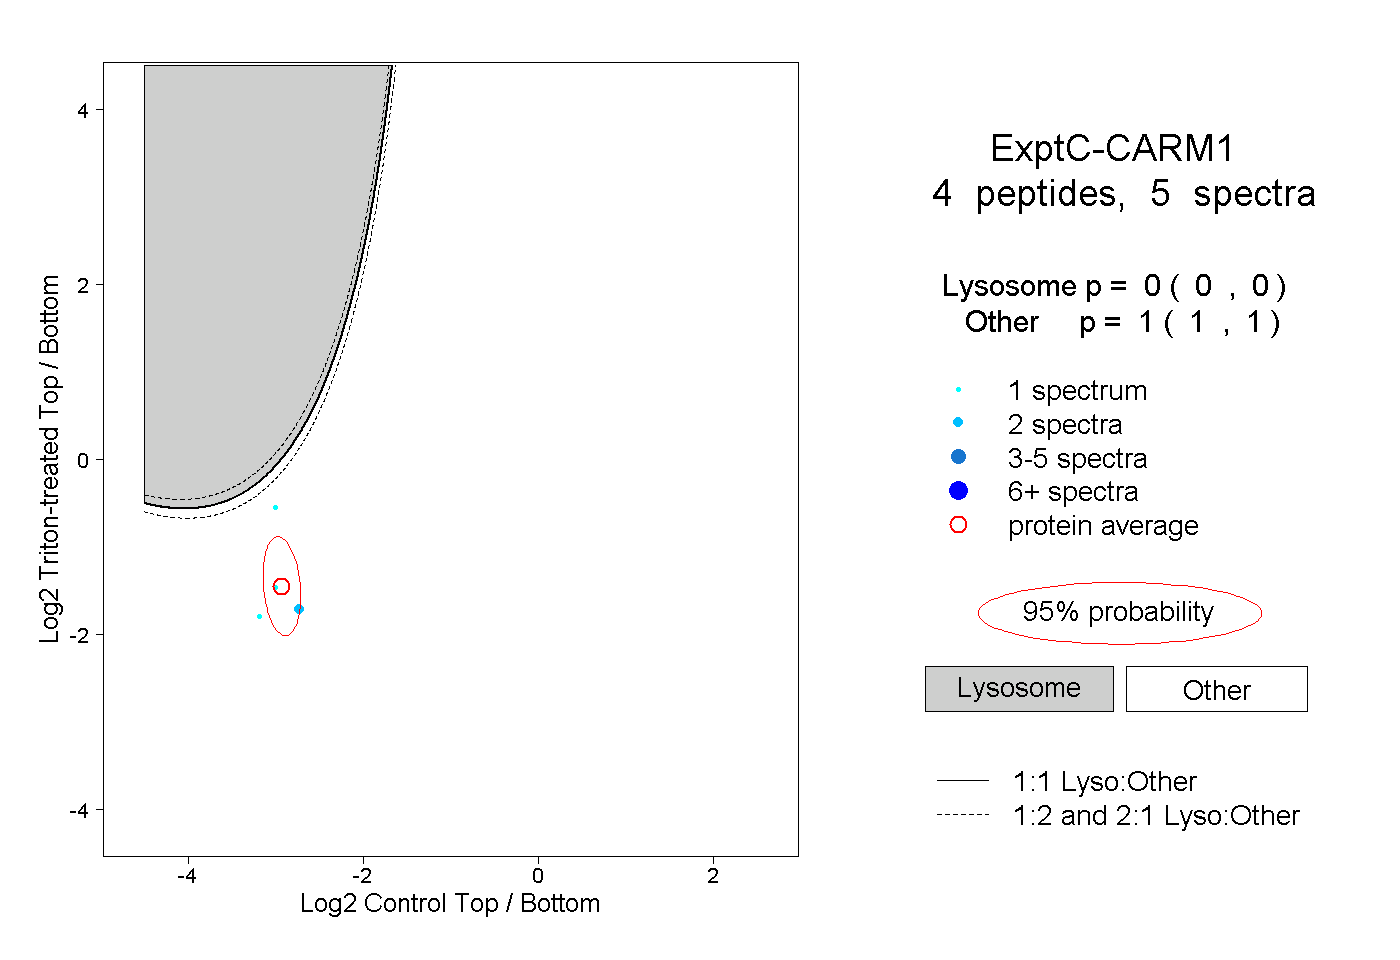 |
0.000 0.000 | 0.000 |
1.000 1.000 | 1.000 |