28
28peptides
spectra
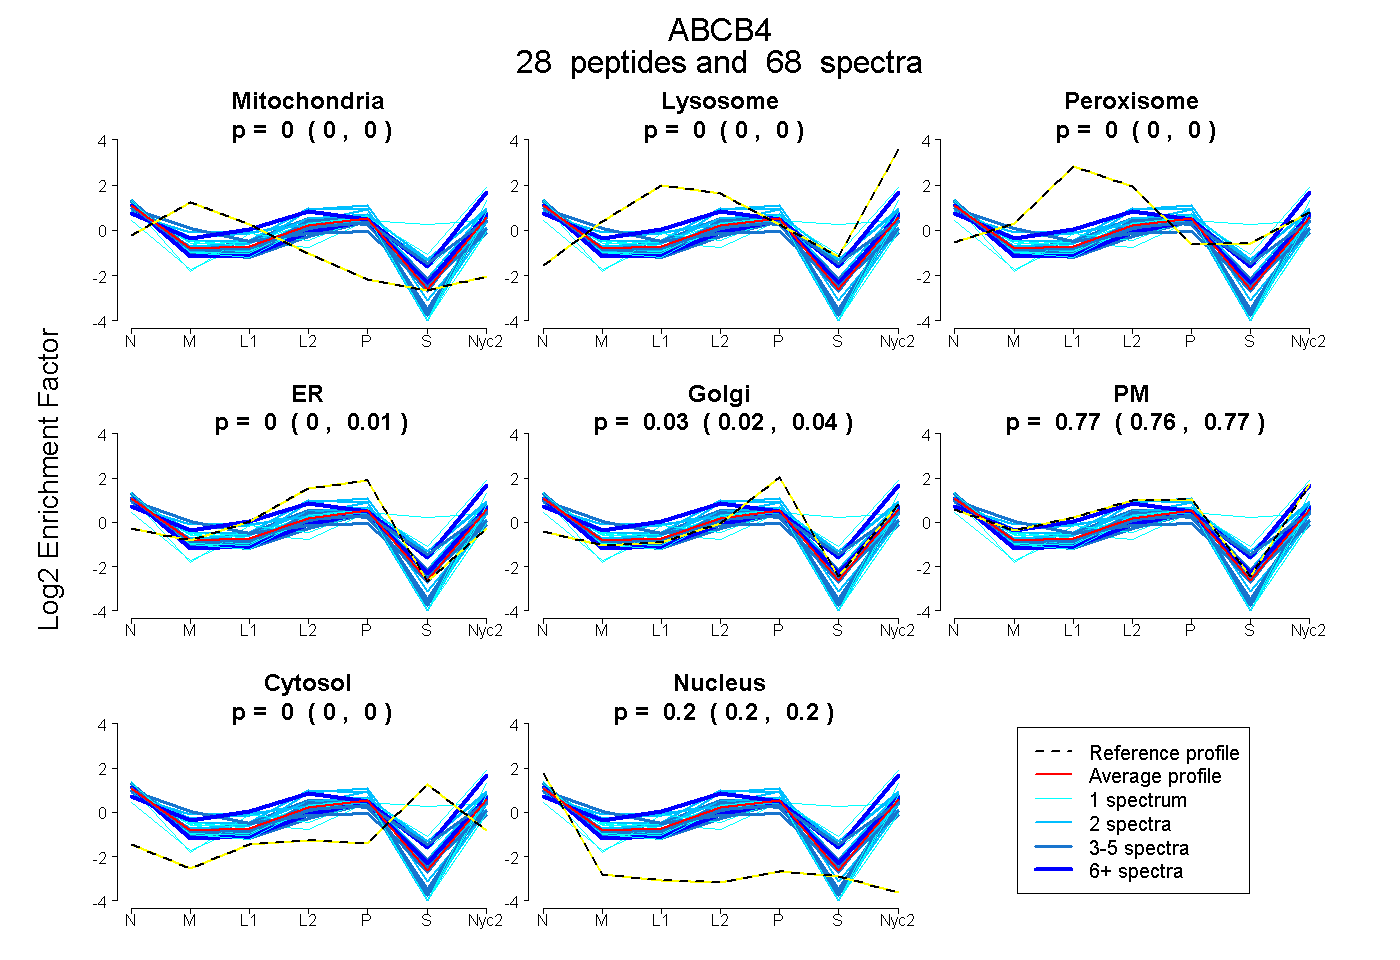
0.000 | 0.000
0.000 | 0.000
0.000 | 0.000
0.000 | 0.007
0.023 | 0.035
0.760 | 0.772
0.000 | 0.000
0.200 | 0.203
7peptides
spectra
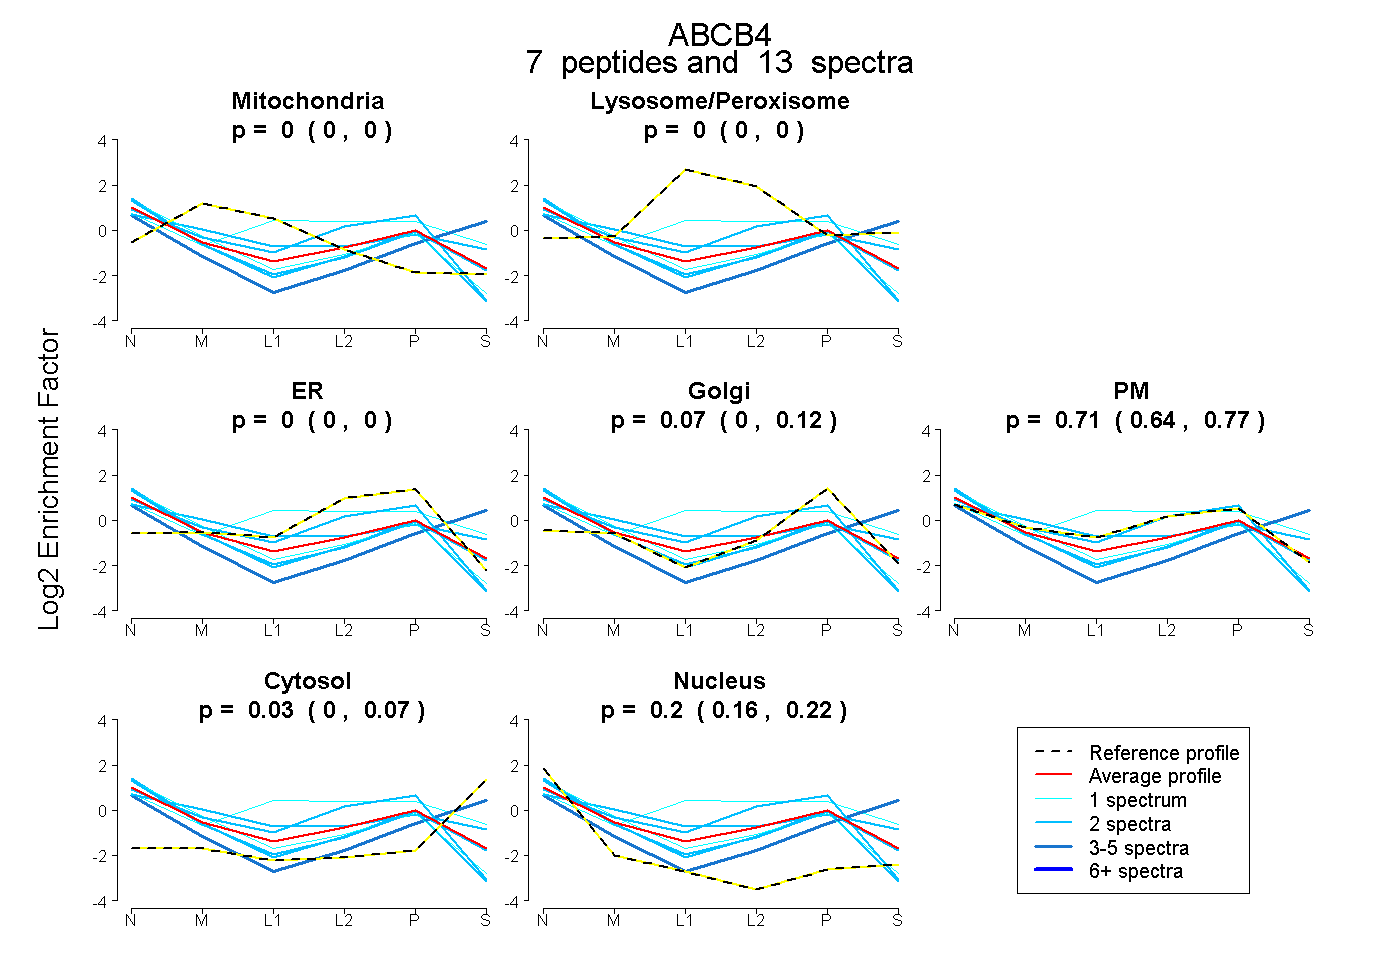
0.000 | 0.000
0.000 | 0.000
0.000 | 0.000
0.000 | 0.124
0.637 | 0.770
0.000 | 0.071
0.161 | 0.223